A closer look to the Short term price action on BTC
Joele Novelli - Twitter: ChainLogAnalyst - Telegram: @ChainLogAnalyst (Joe) - Youtube: ChainLog - Discord: Chainlog - LinkedIn: https://www.linkedin.com/in/joele-novelli-531101248/
Where go next first?
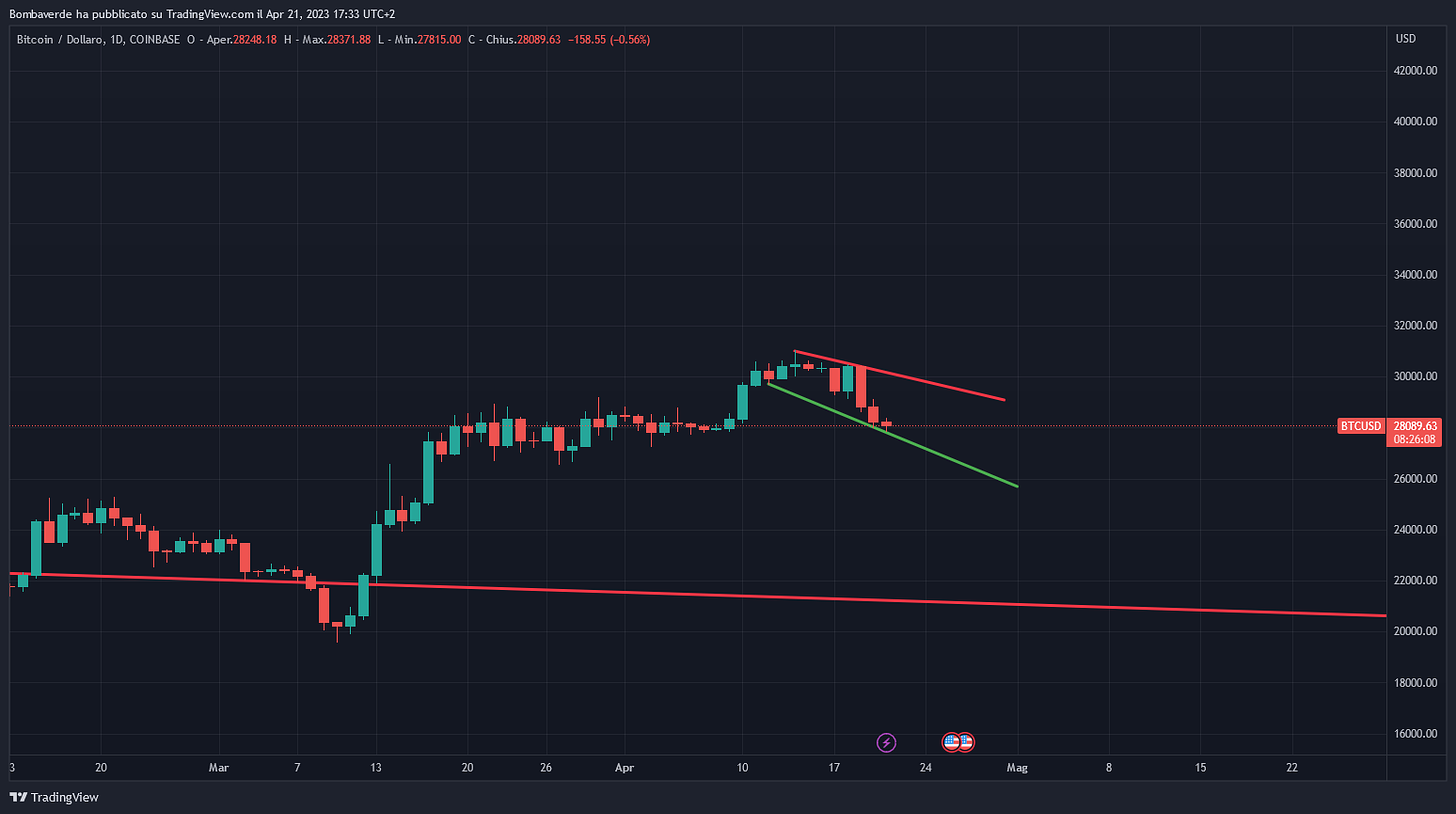
People are telling me we are headed toward 26k I don't think so, that's why
This is a descending broadening wedge https://centralcharts.com/en/gm/1-learn/7-technical-analysis/27-chart-patterns/504-descending-broadening-wedge
Price tends to get higher after forming one of that
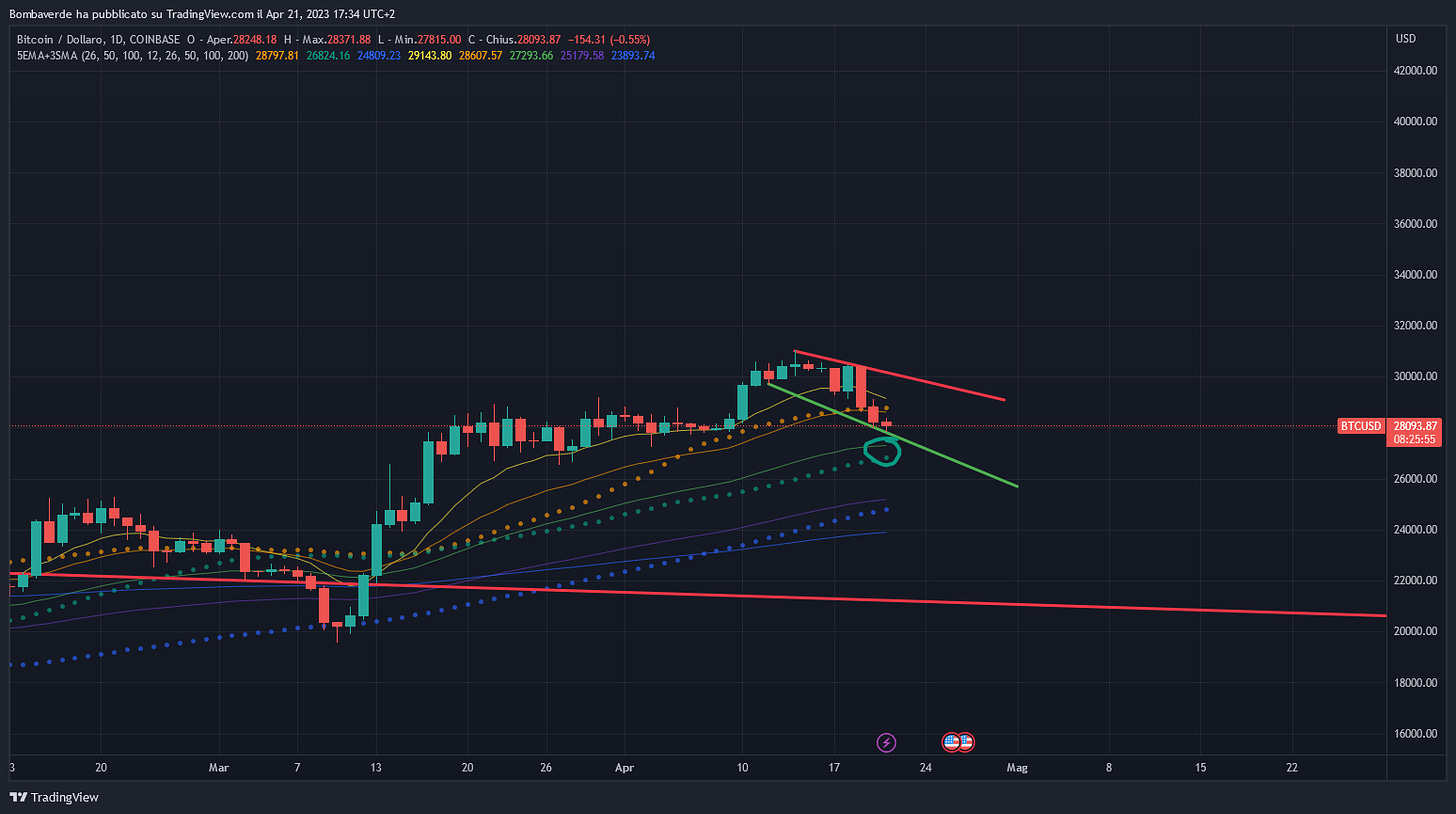
PLUS The 50 MAs (Simple and Exponential) are at 26.8k and 27.3, the second making another support to the lower trendline at support (green) Support is getting stronger
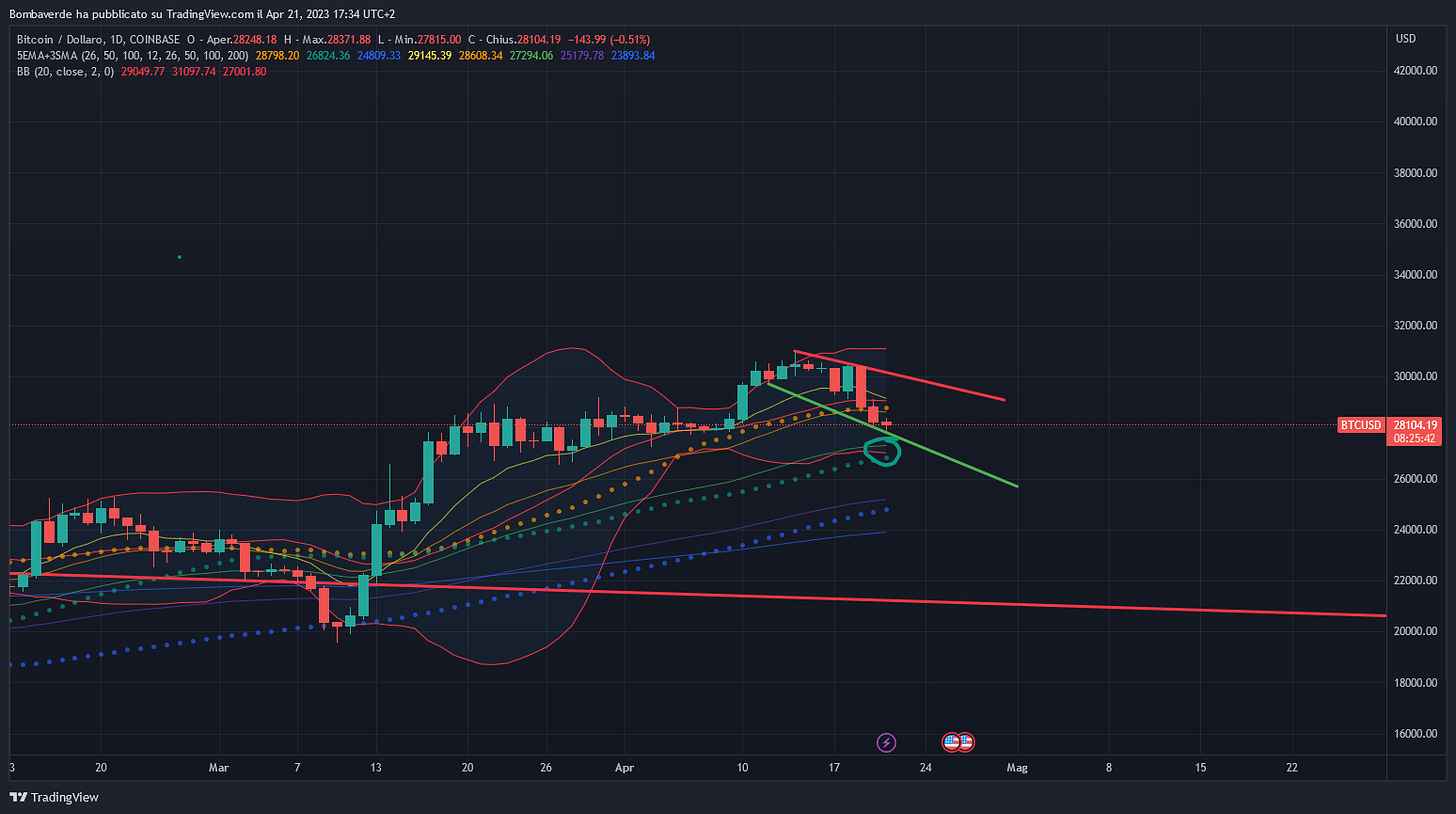
PLUS+ In that zone we have the lower bollinger band as well
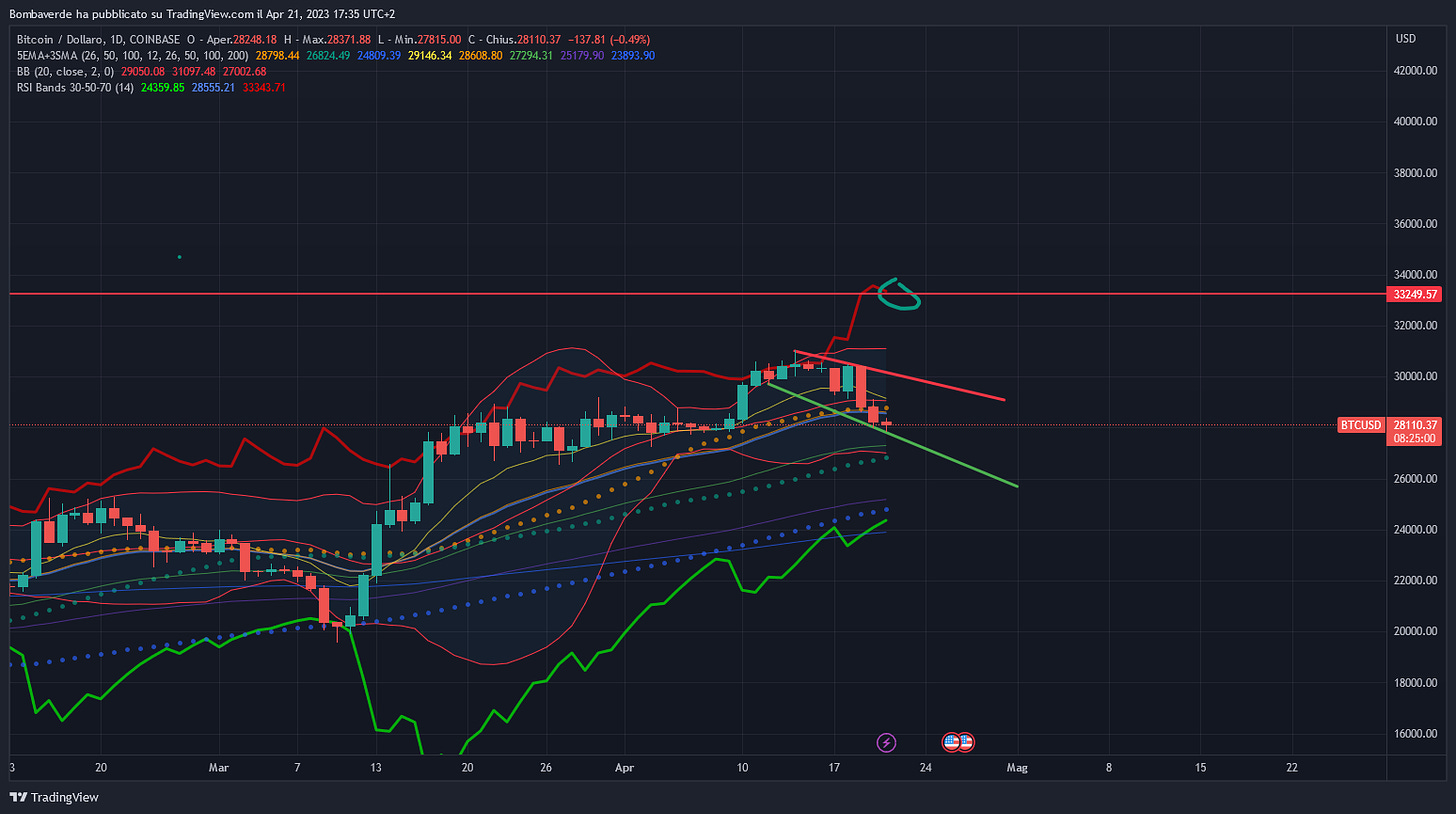
PLUS++ with the price just below the middle RSI
This gets us to 2 targets: The farthest at 33.250 at the 70 RSI, overbought level on the D chart
And the closest the upper Bollinger band at 31097$ The dollars gonna change more or less
So my targets are these Take care guys and girls I'm sure this will help a lot of traders out there Cheers! And as always, not financial advice
(if you wanna more more about technical analysis just go on
http://chainlog.info
for a course or get in touch with me freely here: https://t.me/ChainLogAlphaGroup)


