


Are Long Term Holders convinced in Bitcoin after the SEC lawsuit on BinanceUS and Coinbase?
Joele Novelli - ChainLog - June 13, 2023

Socials:
Twitter - Telegram - Youtube - LinkedIn - Instagram - Newsletter - TikTok
Introduction
Good morning everyone
Today we are here to talk once again about onchain analytics.
For today's article I have chosen seven charts that are aimed at analyzing the holding of BTC by the different categories of hodlers, to understand if after the exit of the SEC against BinanceUS and Coinbase, there is a worrying exit of Bitcoin by exchanges in general, being that the matter for now and forever unless other data, will concern only the United States and that in any case it will produce results in years.
You can find the full English version of what I think about investing at this delicate stage on Twitter, in my podcast
Or find an on-chain analysis with these and other English data on
For the Italian version, I make a weekly recap with all the info: macros, onchain, technical analysis, news and derivatives if necessary
Find the latest HERE
So today we will talk about:
Bitcoin: Total Supply Last Active 1+ years ago
Bitcoin: Total Supply Last Active 3+ years ago
Bitcoin: Total Supply Last Active 5+ years ago
Bitcoin: Total Supply Last Active 6m-12m
Bitcoin: Total Supply Last Active 1m-3m
HODL Waves
Realized Cap HODL Waves
But let's not waste any more time and immediately get into the merits of onchain analysis
Bitcoin: Total Supply Last Active 1+ years ago
In this metric we talk about the inactive supply for + than 1 year, i.e. the category of hodlers of long-term holders
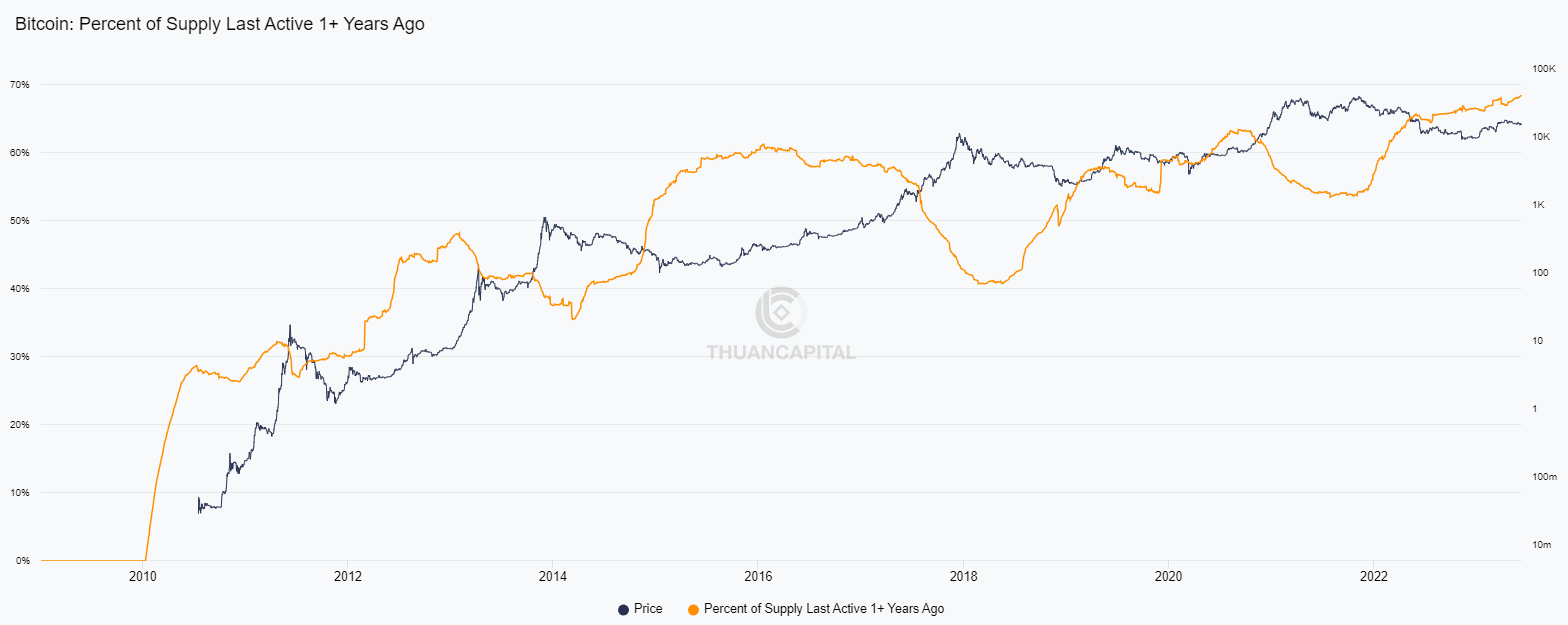
As can be seen, the supply that has been active for more than a year falls during the ATHs and as the price rises to new heights, it also tends to rise quite quickly during bear phases.
In fact, it could be said that this is already an excellent indicator to start your own distribution in the ATHs with DCA
In any case, we are talking about it today because as you can see, in the last period, and after a significant peak, the supply relating to long-term holders is reaching a new ATH (currently 68.42%)
This is important, especially in the last period, because it symbolizes the strength and willingness to hold the asset even in periods of legislative adversity from important government bodies such as the SEC towards the crypto market
Clearly still being a commodity, rather than a security, Bitcoin is still within the regulatory framework assigned to them and is not afraid of the ferocious legislation of these entities, but as it opens, neither are its holders
Bitcoin: Total Supply Last Active 3+ years ago
In this metric we talk about the inactive supply for more than 3 years, i.e. the hodler category of long-term holders with experience
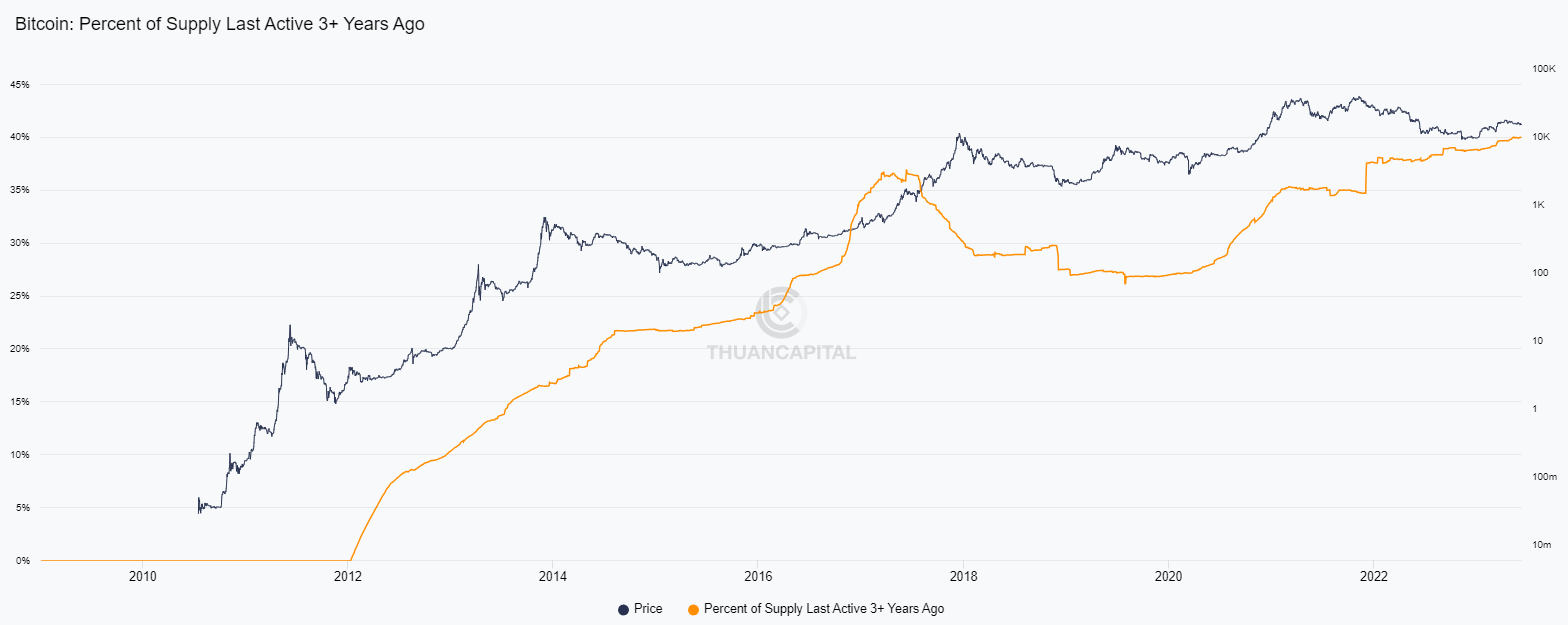
The same thing applies to the inactive supply for more than 3 years, also in ATH (currently 40.08%, i.e. 4 BTC out of 10), which did not happen from the bear market and consequent bull of 2016-2017
This is obviously happening as colors that bought just before the price rally in that period, with prices around $10,000 or below, continue to hold the board at the expense of the 2021 bull market and subsequent top
Conviction for this category of holders is everything, and if they haven't been affected by the latest news either, why worry about the crypto market?
Of course, the tokens will sink in the short term, but any good project will find a way to recover in the next bull market, not being globally excluded from trading
An excellent moment in my opinion to invest in those two or three projects that have a lot of potential and are already established internationally, with excellent partnerships and several years of price history
Bitcoin: Total Supply Last Active 5+ years ago
In this metric we talk about the inactive supply of + than 5, i.e. the category of hodlers of senior long-term holders
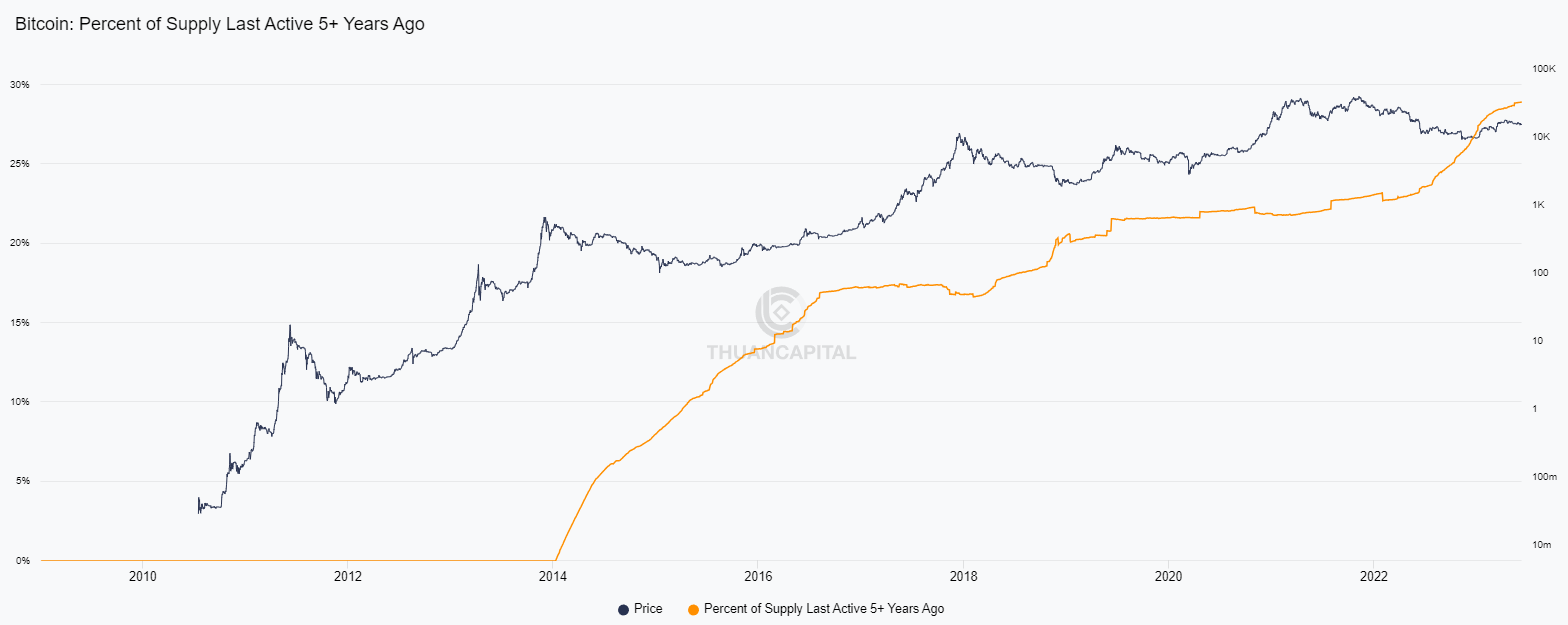
Here we are not talking about ATH (currently 28.93%, almost 3 Bitcoin 10 which have not been moved for more than 5 years) and conviction. You can see for yourself how hodlers that have price values of 7 thousand dollars (being the 5-year limit shortly after the 2017 peak, even 20k, but also less than 7k taking the prices prior to 2016) are still in the market, waiting for Bitcoin becomes the global store of value and therefore probably its mass adoption
Typically hodlers of this type have become maximalists over time, or at least they had become so before. Not caring about the relative value of the asset if priced against the dollar, they continue to hold the asset pending its ultimate goal, that of supplanting the FIAT currency system
In this case we are dealing with holders who make constant DCA, and who enter even more aggressively into bear markets to accumulate and hold even more coins (I imagine that for some of them it has now become pure collecting)
If their support were to fail, the entire network would collapse within months. In fact, they are the ones who support the miners (who by the way could very well be part of this category) by transacting their Bitcoins from the exchanges to their own cold wallets
The fact is that not even from this category of hodlers have we seen a decrease, not even an insignificant one, in the supply
Bitcoin: Total Supply Last Active 1m-3m
In this metric we talk about the inactive supply from 1 to 3 months, i.e. the hodler category of short-term speculators
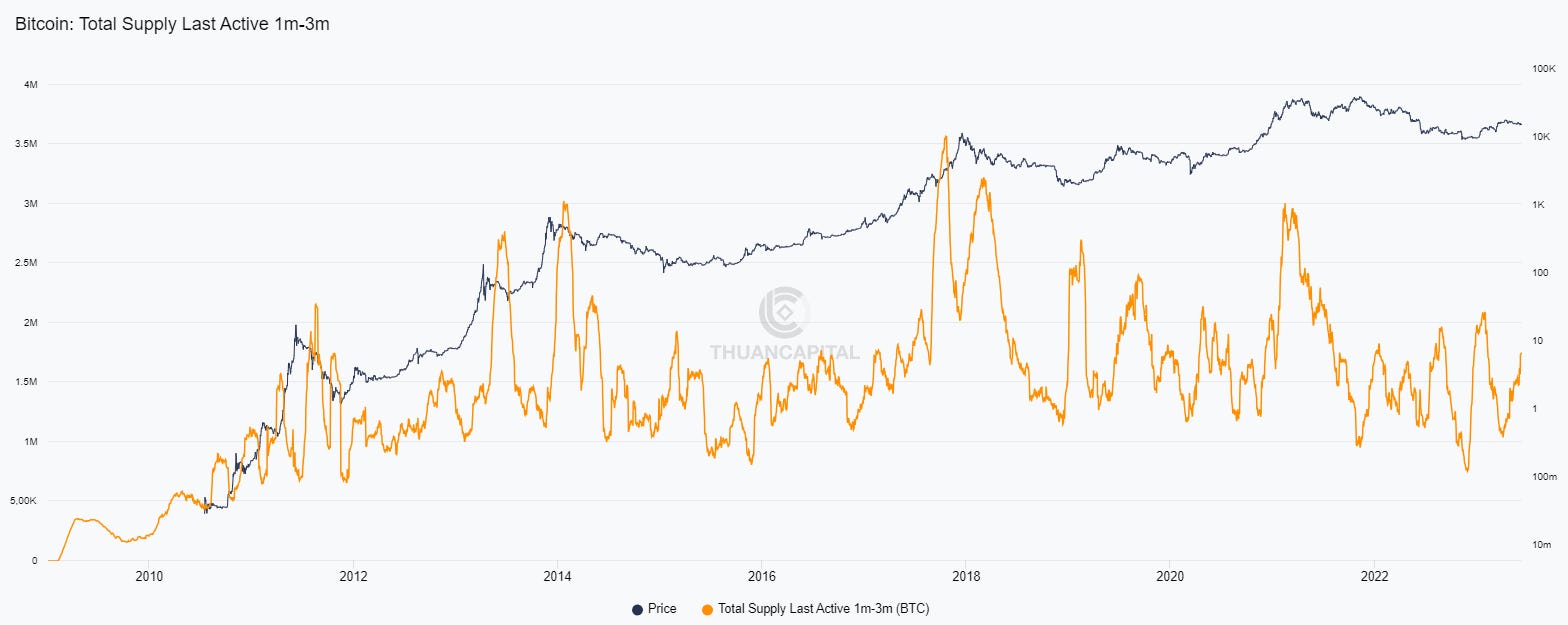
However, we can do a different matter for the inactive supply from 1 to 3 months which, as you can see, varies from peak to peak (and for this reason we do not measure it as a % of the total supply which in any case would be a variation from 5% of the minimums to about 20% of the local maximums and 30% on the macro tops) and which in any case tends to be higher both before and after the ATHs of the price (currently it is around 8%)
At this point it can easily be deduced that it would be useful to use it in conjunction with other metrics and technical analysis values to identify macro and local tops
Even this in the last period, i.e. from the last rise in prices towards 30k, tends to increase, without however reaching peaks higher than the previous ones and therefore suggesting that a drop in prices in the short term could be on paper
Something already seen (and which is part of my latest analysis on youtube that you find HERE) regarding what could have happened to Bitcoin in the days following the achievement of 25k, which we used to support as per the forecasts of the previous analyzes
Bitcoin: Total Supply Last Active 6m-12m
In this metric we talk about the inactive supply from 6 to 12 months, i.e. the category of hodlers that we could call "long-term novices"
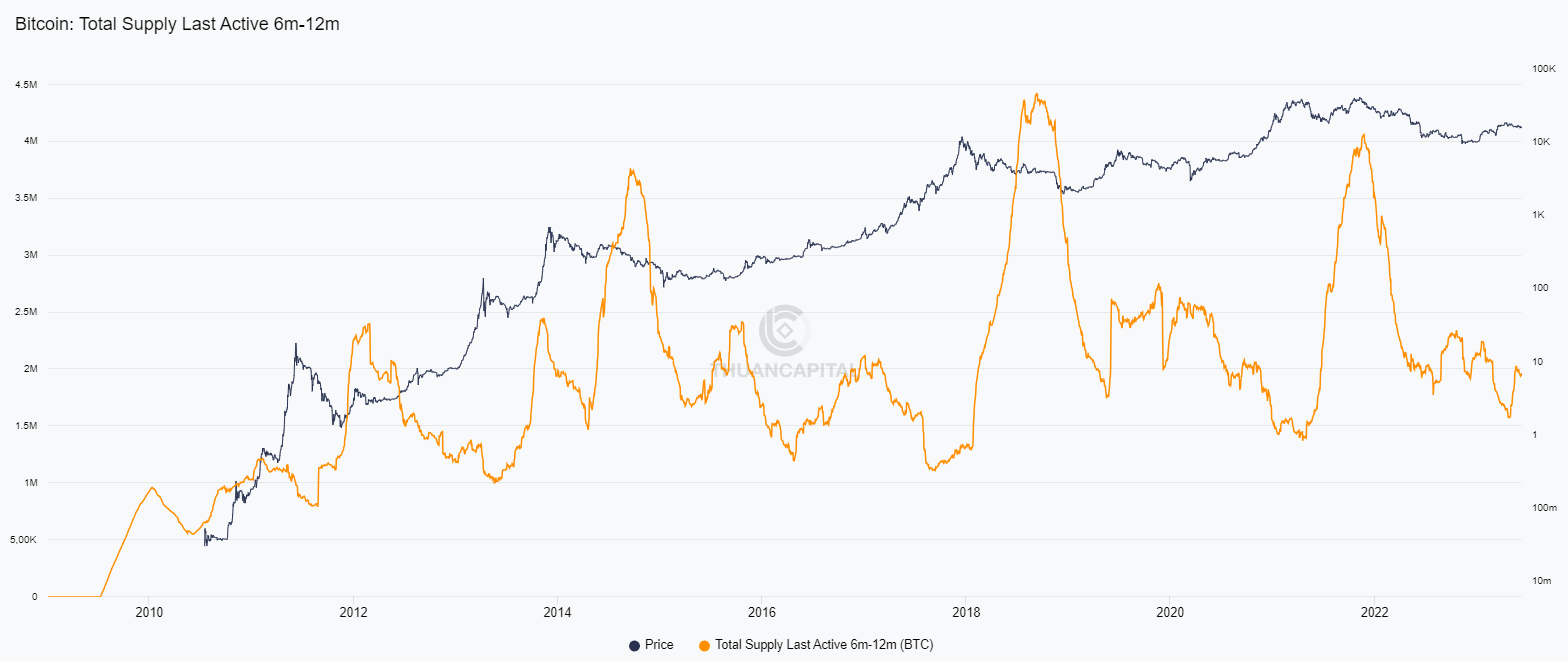
In this penultimate metric we can observe how the long-term novice holders, who bought Bitcoin from the last drop in prices from 30k before the bottom and up to the concrete bottom, have instead suffered a drastic decrease due to:
1 - Aging with supply longer than one year
2 - the sale at a loss
3 - the sale during the last price increase
This metric is also laggy, which means it comes in late, when compared to the price. In fact we see how it has its own ATH about 6 months after the first ATH of each cycle.
In this case, a bottom of the metric marked the initial stages of a new bull market within a few months (another thing I've talked about many times as the "seed of the bull market", a period that in my opinion we have just entered, but that will be visible to everyone only during the next year.
HODL Waves
This metric categorizes the various hodlers by age group in which they hold the asset, graphing the percentage dating back to their own group each day (color)
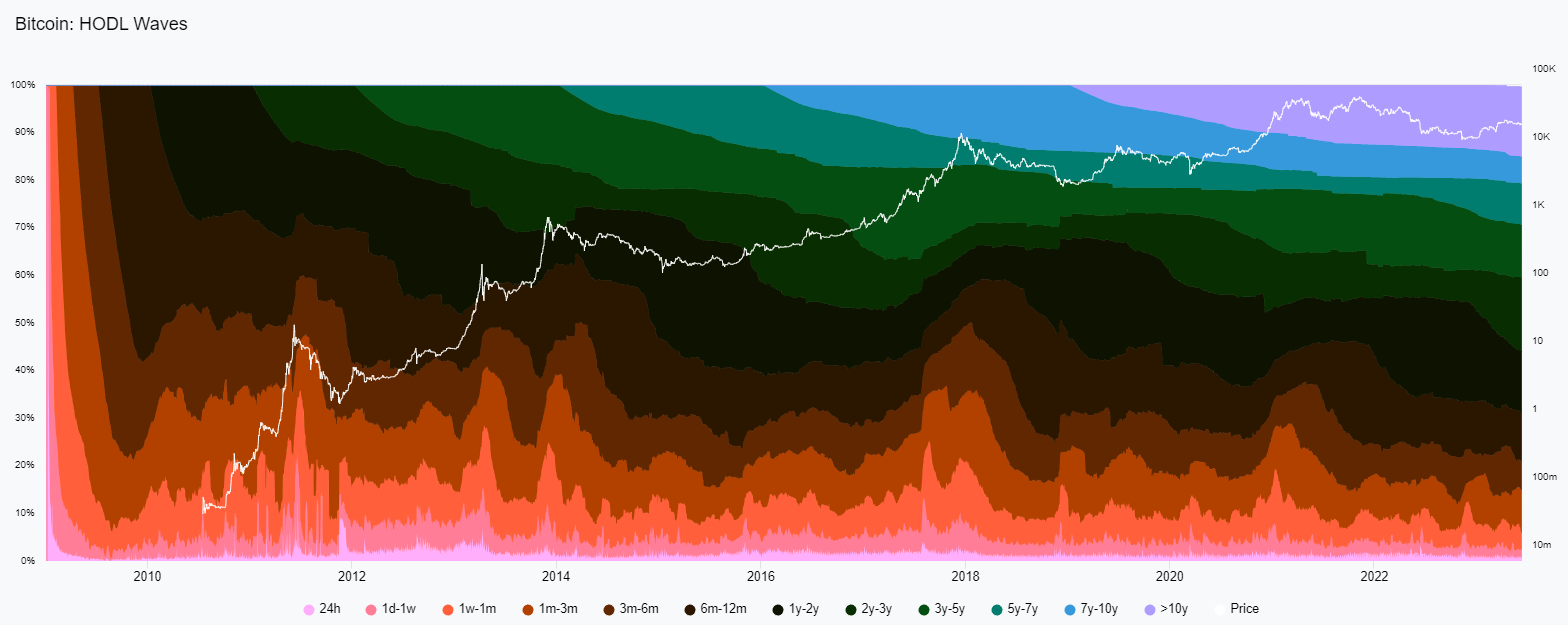
From the HODL Waves, this increase in the supply held by long-term holders is perceived even better
In fact, you can see how the percentage of colder and darker colors increases cycle after cycle, marking new highs against that of the short term holders (warm colors) which instead continue to decrease with each cycle.
This is a metric that I wanted to look at just to demonstrate in a self-evident way that an increase in long-term holders is not only about the last cycle, but more generally it concerns the entire history of the asset
So nothing to worry about in the short term
Realized Cap HODL Waves
Instead, this metric takes the basic onchain cost of the asset for the various hodler groups divided by age.
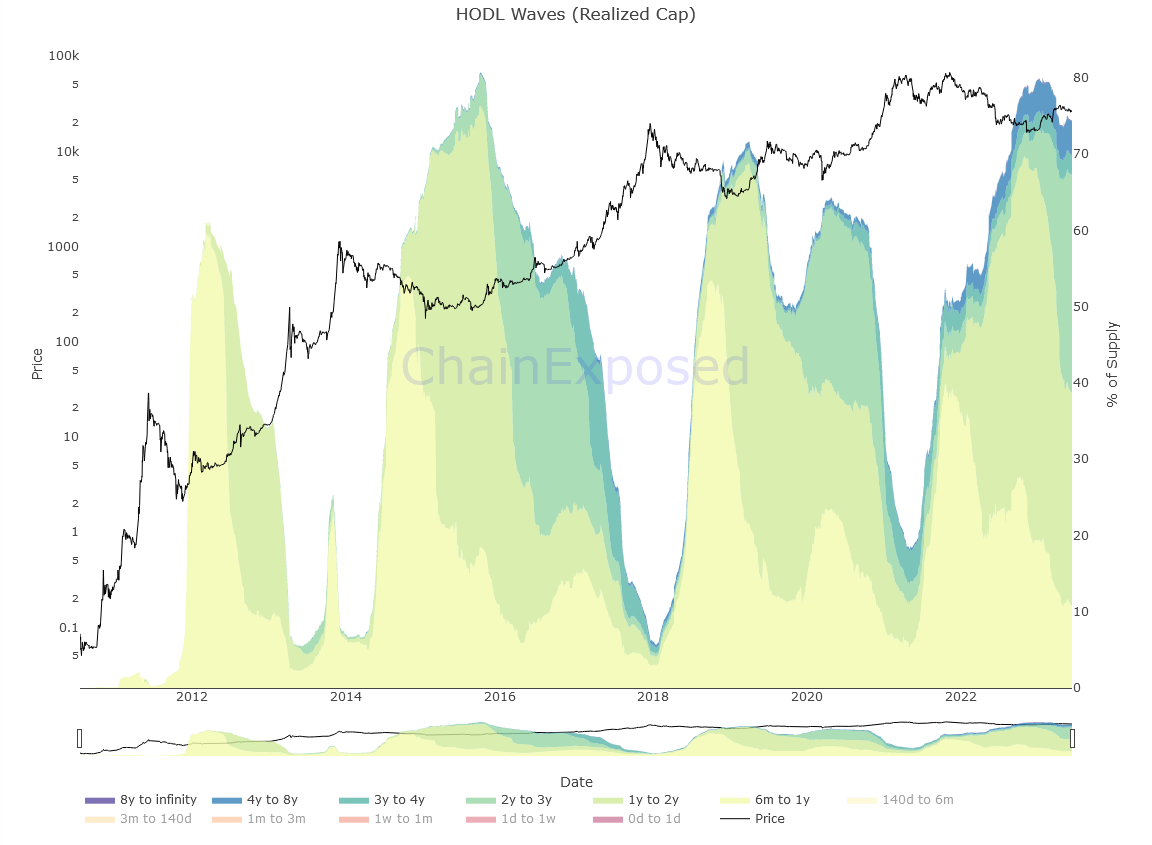
The realized HODL Waves cap shows us that in each cycle, the majority of moves in and out of portfolios to be sold or transferred, come from 6 month to 3 year hodlers, with little belonging to the 3 or 4 year and 4 to 8 years
This proves even more that long-term holders exceeding 3 years of hodling holding won't be selling for very long
Only in the last cycle can we see that 4 to 8 year hodlers start to make profits, which means we start to have people in the markets who are actually swing trading bear market lows and bull market highs
That's all for today, but remember: when in doubt, zoom out
Good day!
Author
Joele Novelli - ChainLog
Socials:
Twitter - Telegram - Youtube - LinkedIn - Instagram - Newsletter - TikTok
(All opinions expressed above are the author's personal opinions and should not form a basis for making any investment decisions, nor should they be construed as a recommendation or advice for engaging in any investment transaction.)