Joele Novelli
Twitter: https://twitter.com/ChainLogAnalyst
Telegram: https://t.me/ChainLogAlphaGroup
Youtube: https://www.youtube.com/@chainlog9504
LinkedIn: https://www.linkedin.com/in/joele-novelli-531101248/
Instagram: https://www.instagram.com/chainlog_ig/
Newsletter:
Good morning everyone
Today we are here to talk once again about onchain analytics.
For today's article I have chosen 6 graphs that are specifically aimed at analyzing the profitability of market participants in search of any danger signals regarding price action in the short term and therefore of indications that by engaging with technical analysis they can give us cause for concern in the short term.
So today we will talk about:
SOPR - Short Term Holder SOPR - Long Term Holder SOPR
Supply in Profit/Loss (%)
Short Term Holder Realized Price
Long Term Holder Realized Price
But let's not waste any more time and immediately get into the merits of onchain analysis
If you want a more indepth on technical analysis for the last days watch this thread on Twitter:
https://twitter.com/ChainLogAnalyst/status/1649439944627175424?s=20
SOPR - Short Term Holder / Long Term Holder SOPR
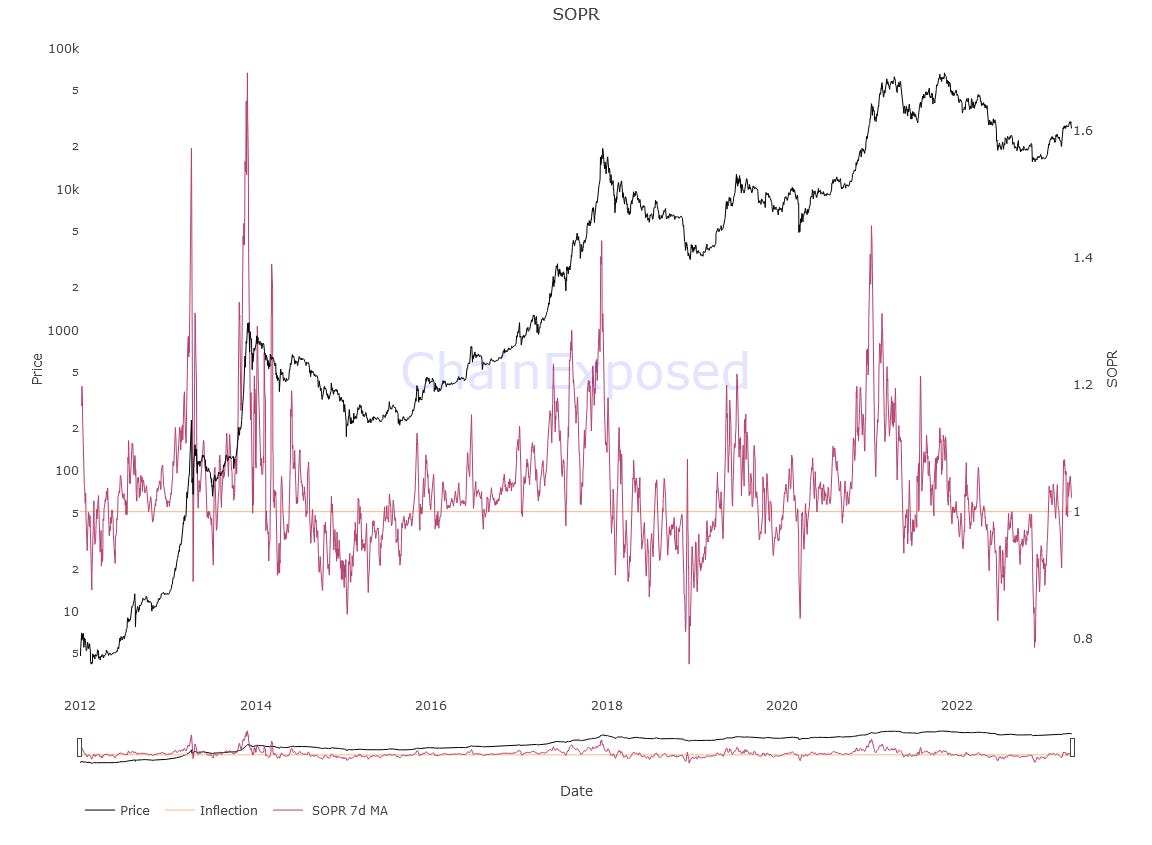
The SOPR metric, Spent Output Profit Ratio, looks at the unrealized profit or loss by market participants.
When the metric approaches the value of 1 it means that market participants are in aggregate at the break-even point, or at parity with the realized value onchain.
When it is below the orange line of 1 instead we are in a state of unrealized loss, so market participants are holding at loss and vice versa for the metric above 1, with 2, 3 cc ... which are multiples of unrealized profit
As you can see, this metric tends to stay above 1 in the first and last phases of the bull market, retesting that break-even point as support multiple times during the rise and doing exactly the opposite during the bear markets, i.e. using the '1 as resistance.
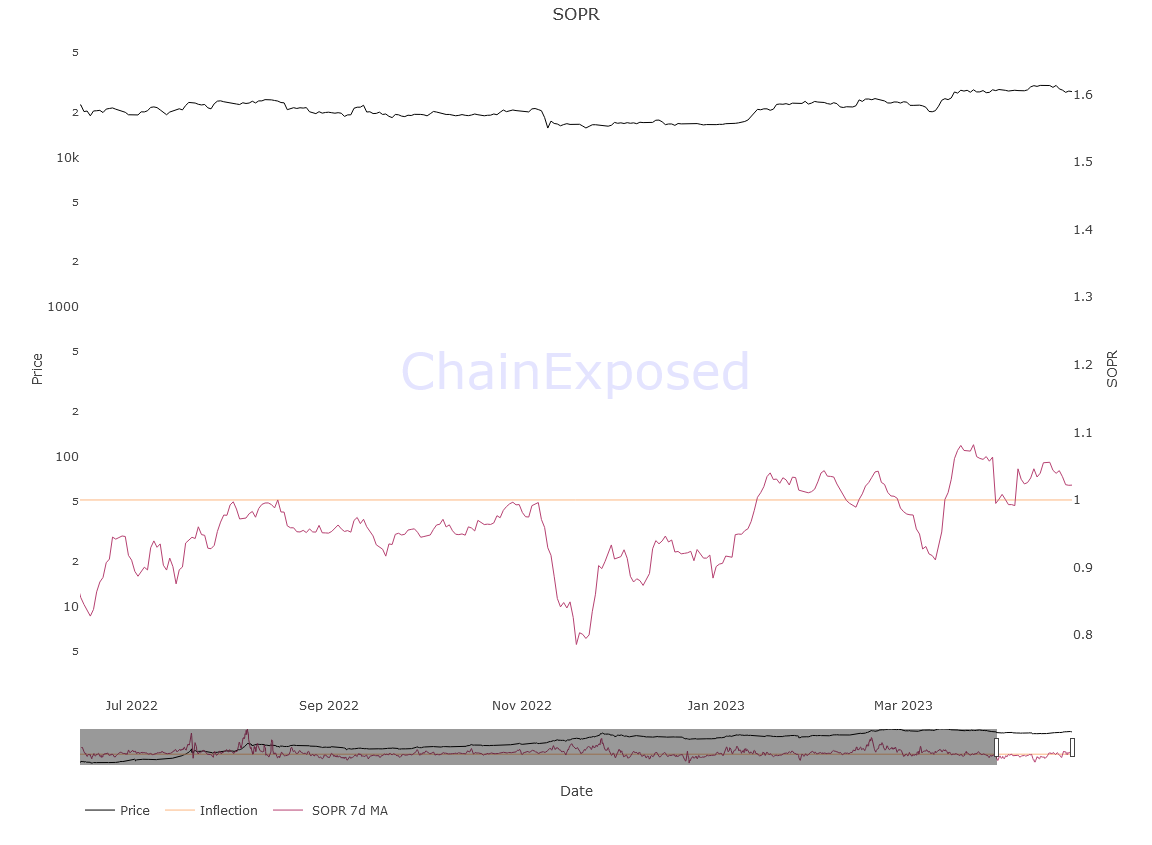
As you can see, in the last few weeks, this metric has moved to the top, and has started using the 1 as support
We are therefore here in a very delicate equilibrium point, which if retested again could lead to a considerable increase in prices in the short term, but which if lost could lead to an equally rapid decline.
But we tried not to dwell here and let's look at this metric in more detail with two of its derivations.
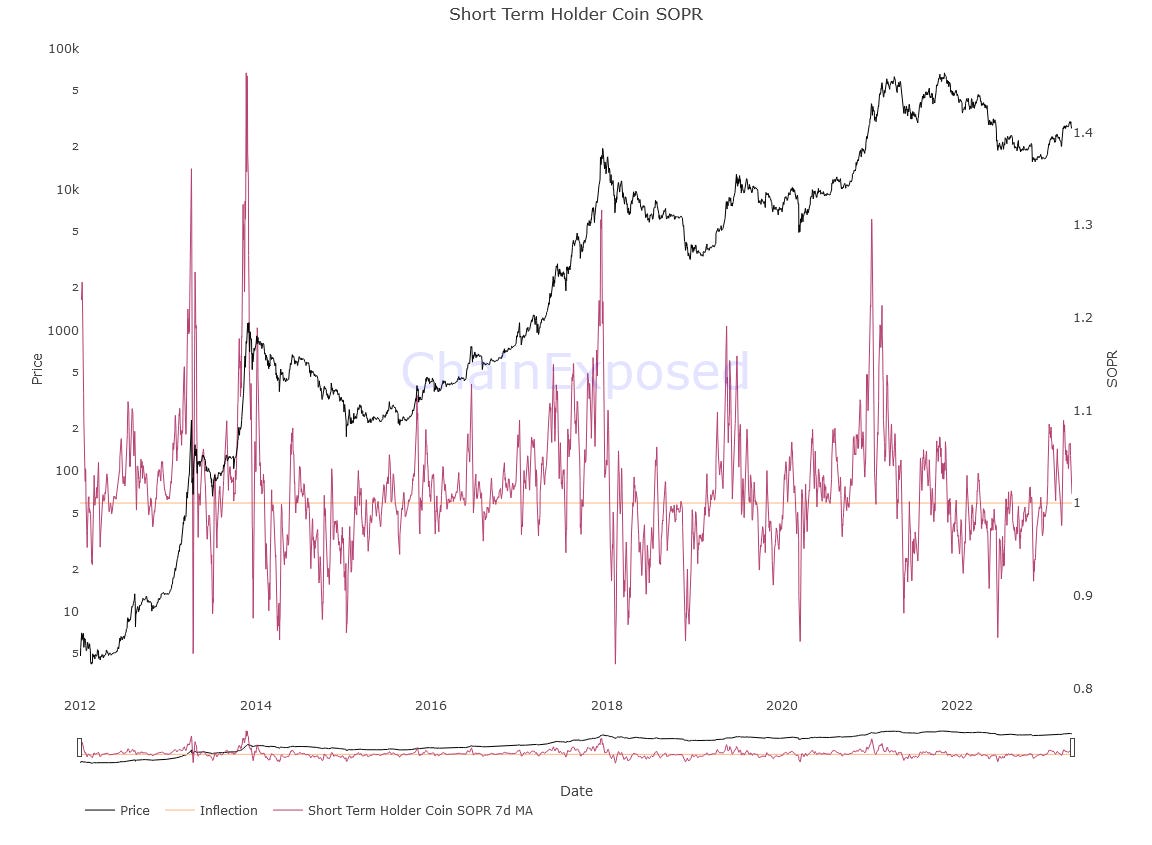
The Short Term Holder SOPR is the equivalent metric of the SOPR but for short term holders, i.e. concerning the holders of the asset who have held BTC for less than 139 days, on average less than 5 months
In this case the applied concept is the same, and here too the metric seems to approach the break-even point again.
So nothing new under the sun, but will it be the same for long-term holders?
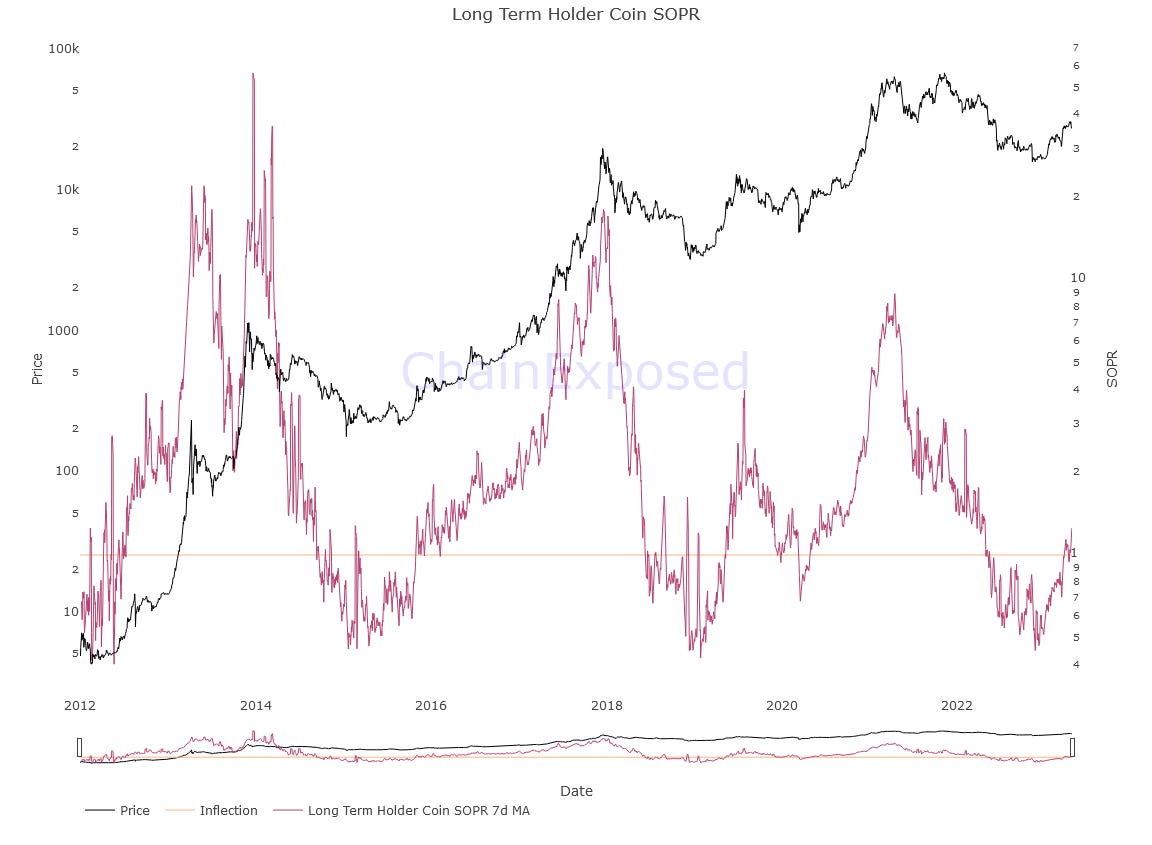
The Long Term Holder SOPR is the equivalent metric of the SOPR but for long term holders, i.e. concerning holders of the asset who have held BTC for more than 139 days, on average more than 5 months.
In this case the situation is different, since this category of hodlers seems to be much more profitable than the first and if you notice the movement it seems to mimic that of the initial phases of the previous bull market, when we recovered from the 3k abyss, or the previous one again .
This doesn't give us clear indications of short-term price action, but it speaks volumes about the possibility that the bull market is now entering its early stages.
Supply in Profit/Loss (%)
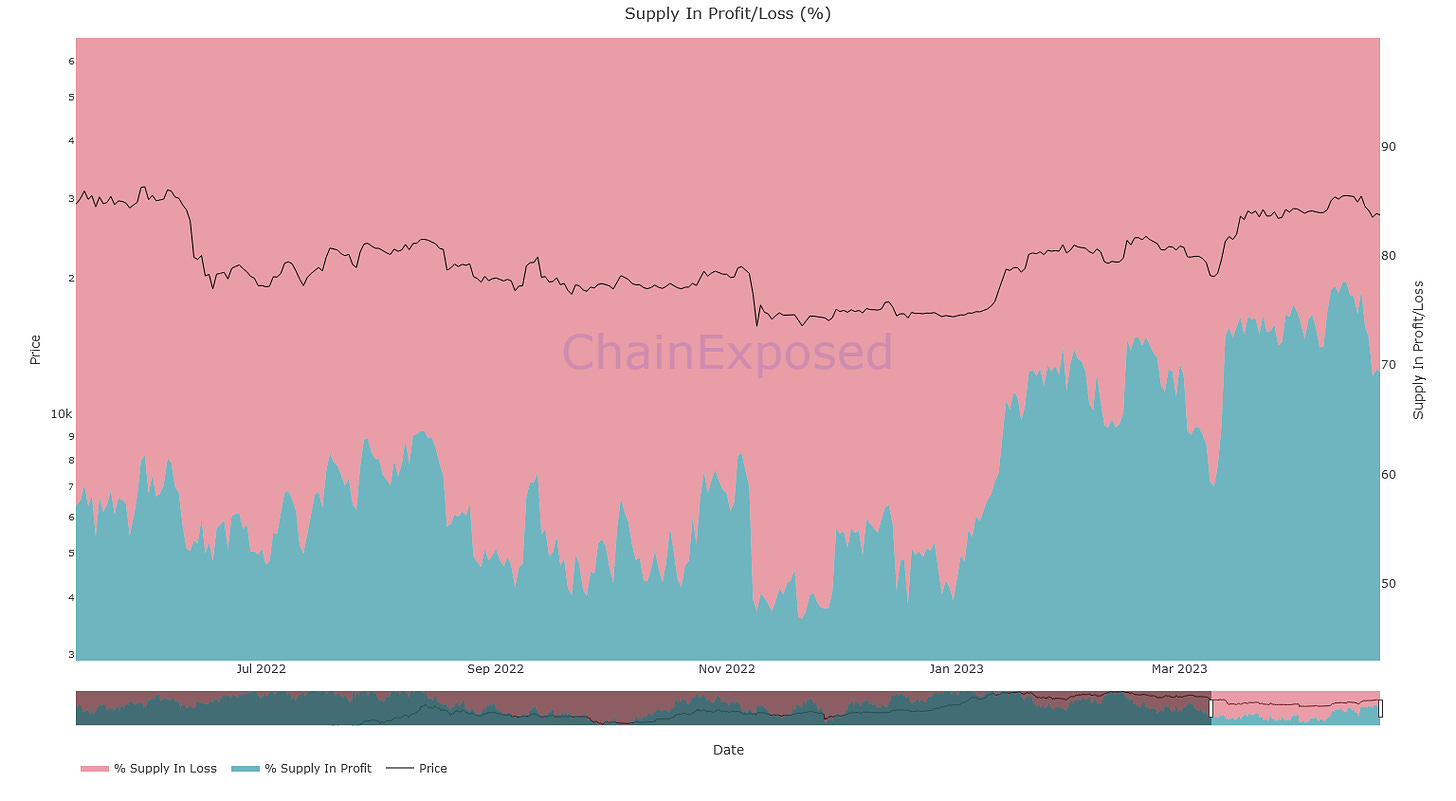
Supply in Profit/Loss (%) is an onchain metric that allows us to identify the percentage of the Bitcoin supply that resides in a state of profit or loss, regardless of the actual amount of unrealized gain or loss.
In practice, even after only one dollar in profit, the supply of this example begins to be part of the supply in profit, and vice versa.
As can be seen, the percentage of Supply in profit tends to fall below 50% in the deepest bear markets, to reach 75% in bear market rallies and then fall again, to break and retest the 75% support several times in the initial stages of the bull market and to reach above 90 and up to 100 during the macro tops.
Recently, Supply in Profit has retested the 75% resistance, the first sign of a possible downside bubbling under the surface. Actually this metric alone doesn't tell us much, but if put together with the remaining metrics in a delicate balance, they could lead to think that the downside is imminent.
In reality, nobody knows where the market will go, but one can always take care to prepare against all possible eventualities, or at least those to which one can refer through the different types of analysis available to us.
To find out where I think the short-term targets are, take a look at my latest post on price action on Twitter, which I update every day to stay on top of things.
Short Term Holder Realized Price
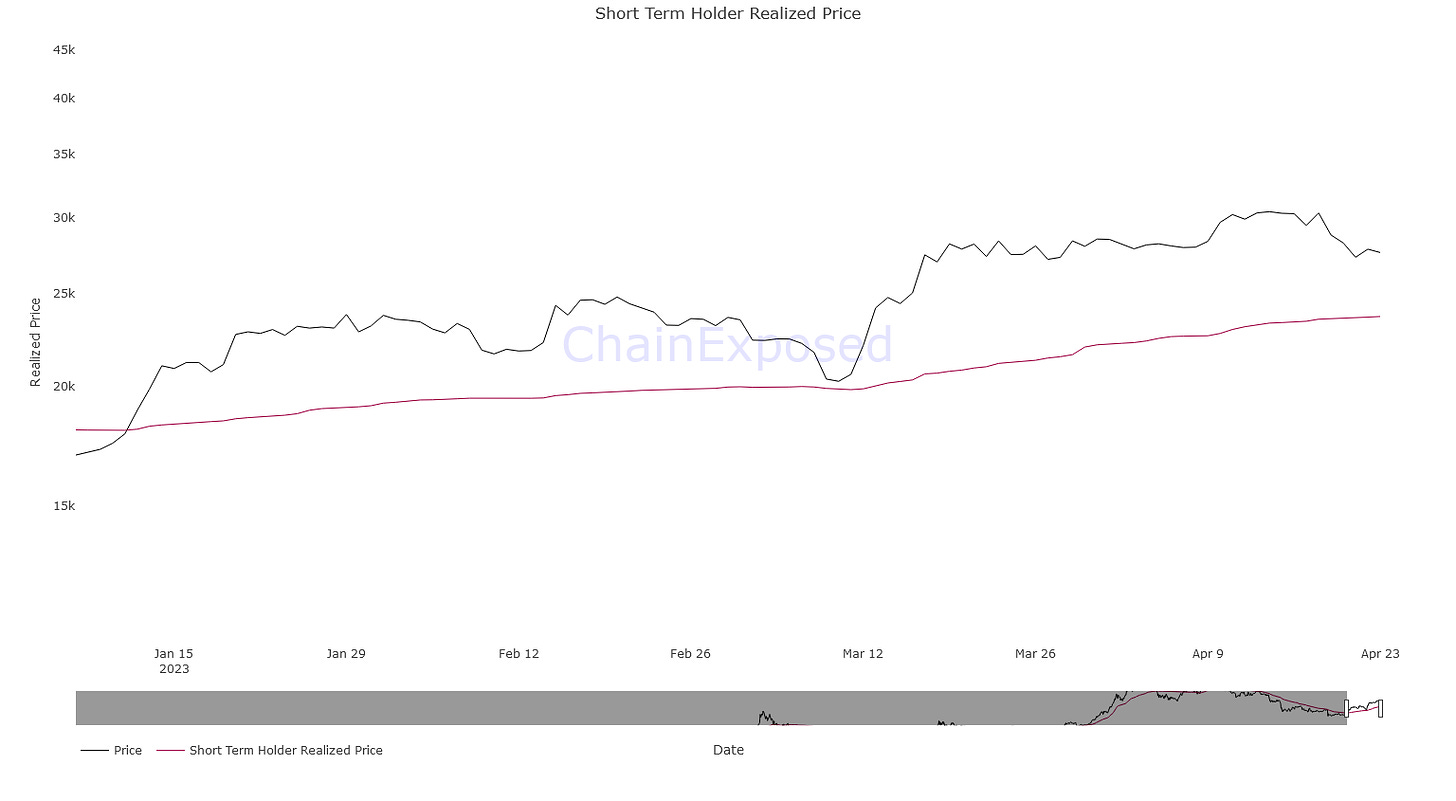
The Short Term Holder Realized Price is essentially the on-chain base cost of the asset for short-term holders, who have held the asset for less than 139 days or in any case on average for less than 5 months, to put it simply.
As you can see from the graph, it has always been necessary for the price to recover this metric and use it as support so that we could speak of a bull market, albeit in its most infant stages. The same is true for bear market periods, where this metric is used as a fundamental resistance at each rebound for a subsequent, even acute, price drawdown.
We have retested the affected price range lately, and after using it as support, we bounced higher. This is exactly how we expect price to behave when compared to this all-important metric.
Now, since we have been stuck at these levels for a while, what can be expected is that the price will retest the aforementioned short-holder realized price line, so as to use it again as support and push higher. or in view god truly alarming news of losing it to push it down again and again.
In this case the metric is 26.6k, a price range that we have come very close to today.
So everything coincides, but what about the rebound?
For my technical analysis you know where to find me.
Long Term Holder Realized Price
The Long Term Holder Realized Price is essentially the basic on-chain cost of the asset for long-term holders, more than 139 days or in any case more than 5 months on average.
Here we find once again an abysmal difference between the two types of holders of the asset.
In fact, if in the graph concerning the short term holders we notice a continuous test of the metric, here instead we have a retest of the metric and therefore a sinking of the price below it only in moments of extreme downward volatility of the price, i.e. in the depths of the bears market.
Another thing we can note then is that every time we manage to penetrate the line upwards again and we manage to retest it as support, what usually follows after months of slow rise is nothing more than a bull market. which right now, provided that there are no other unforeseen fluctuations, we could already define as in its initial stages.
(All opinions expressed above are the author's personal opinions and should not form a basis for making any investment decisions, nor should they be construed as a recommendation or advice for engaging in any investment transaction.)


