Retailers and institutions - A study case on Bitcoin major fundamentals
Joele Novelli - ChainLog - May 20th 2023
Socials:
Twitter - Telegram - Youtube - LinkedIn - Instagram - Newsletter - TikTok
Introduction
Good morning to you
Today we are here to talk once again about onchain analytics.
For today's article I have chosen four types of charts that have the purpose of analyzing Bitcoin's fundamentals to understand if the coming bull market has legs or if the next price rises will be due to pure speculation and therefore must be watched with caution.
Find the full English version of what I think about investing in this delicate phase on Spotify HERE, in my dedicated podcast, where every day I share my thoughts on market events, price movements and the impact of news and macroeconomics on the crypto market.
You can find another longer and more detailed analysis in video format on my youtube channel by clicking HERE
So today we will talk about:
Address Bands Balances
Exchange Reserves (BTC ed ETH)
Miners Reserves
Active addresses
But let's not waste any more time and immediately get into the merits of onchain analysis
Address Bands Balances
Address Bands Balances are the metrics we use to better understand the movement of the supply held by the various categories of hodlers, and which answer the question: Who is hoarding? And who by distributing?
Starting with the humpbacks (10k or more BTC) we can see how in the last period, they are simply consolidating their position after small buys in the deeper bear market which they then translated into profit during the last rise to 30k.
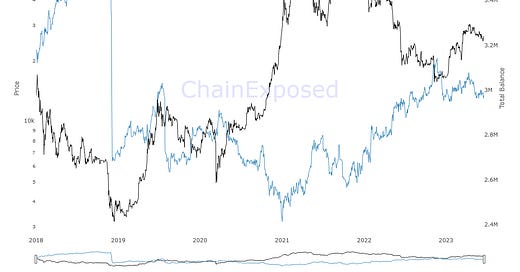
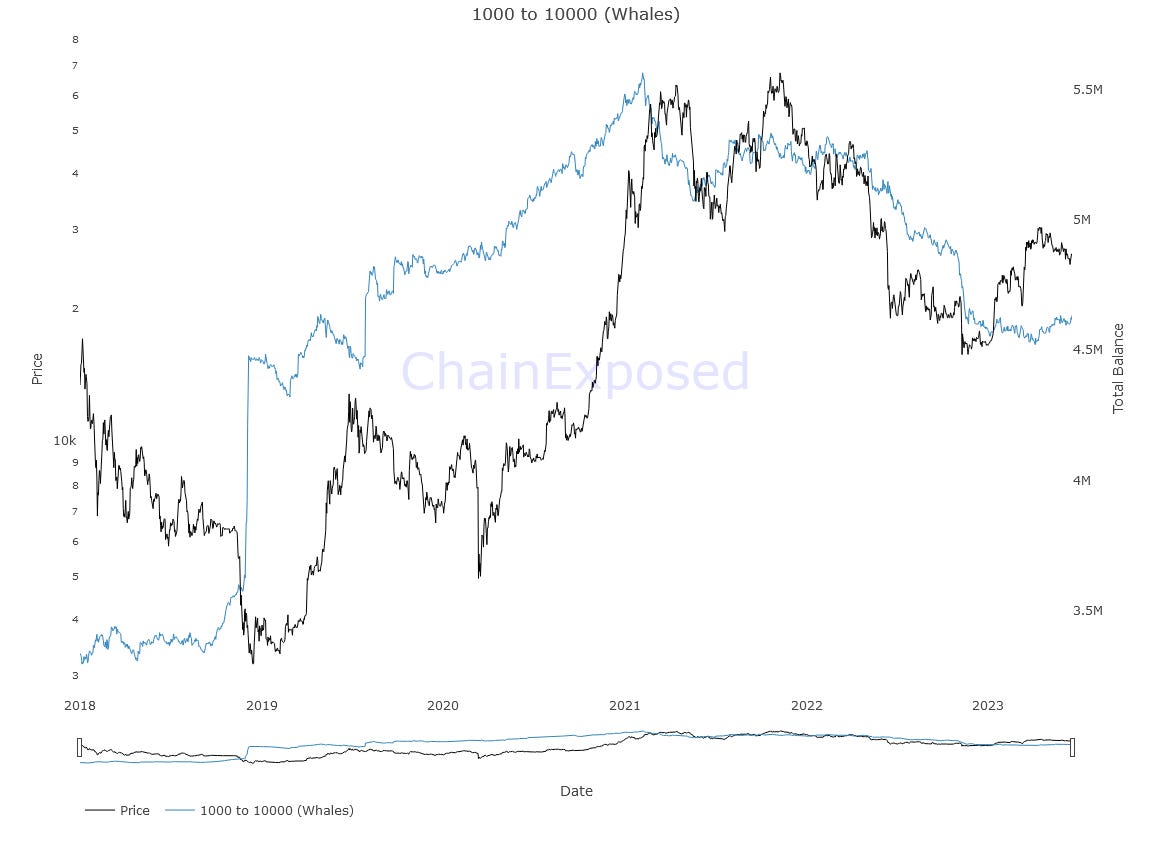
The same thing goes for whales (from 1k to 10k BTC) which, however, do not seem to have exploited the latest price rise in the same way.
Which instead the sharks have well thought of doing (from 100 to 1k BTC). In fact, despite the long and very slow consolidation in the depths of the bear market, the latest supply movements concern precisely the local minimums and maximums.
Fish (10 to 100 BTC) are the most interesting category in my opinion, as they seem to understand exactly when it's time to accumulate and when to distribute.
In the last period they have certainly not spared themselves from buying quite a lot of the BTC held on the exchanges, bringing their reserve to 4.45 million from 4.25, an increase of 200k BTC, and despite everything, they continue to accumulate albeit more slowly.
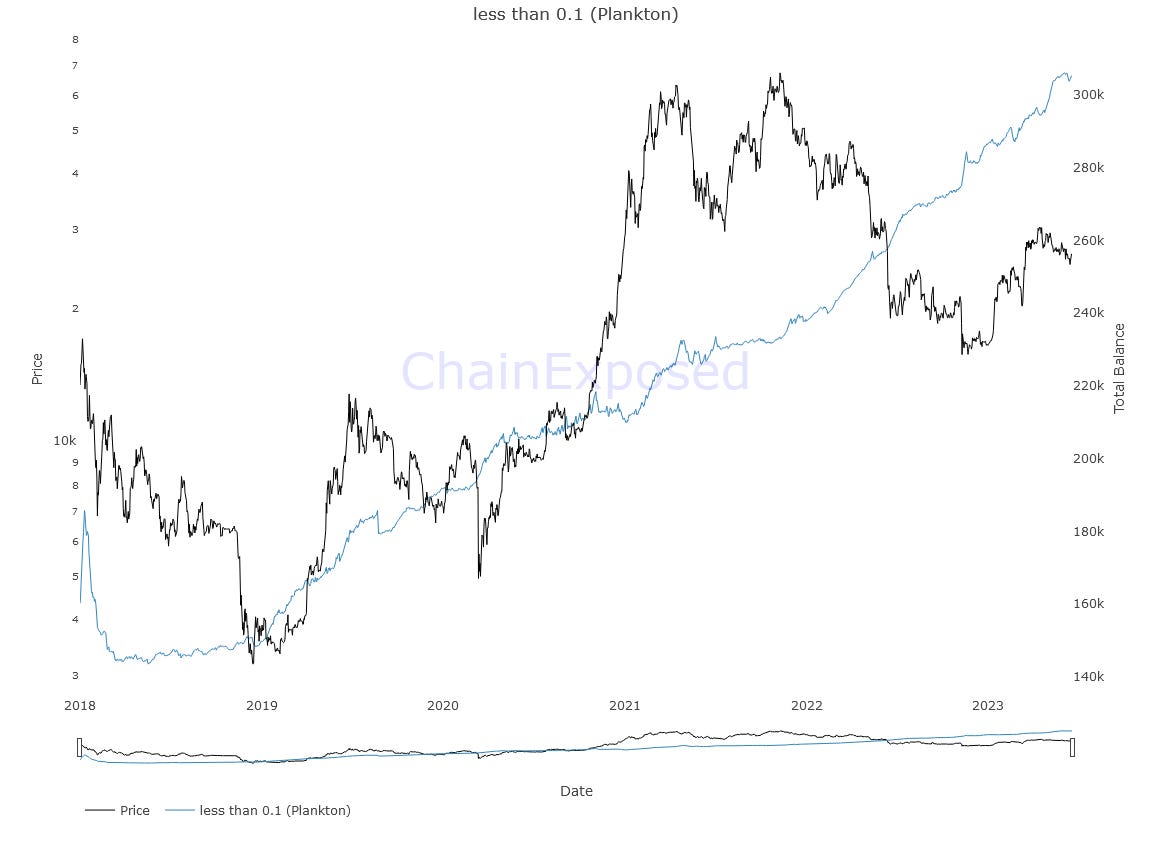
Crabs (from 1 to 10 BTC) have instead always been in the accumulation phase as well as the following categories, and which you see below, namely shrimp (from 0.1 to 1 BTC) and plankton (less than 0.1 BTC), with some sudden growth precisely in periods of greatest price weakness.
Why am I talking about the reservations of these hodlers?
Because they are the ones who will lead us into a new bull market thanks to their constant and unscrupulous buying pressure, especially if the selling pressure of the whales and humpback whales seems to have roughly stopped, focusing only on the local lows and highs.
So we have the buying pressure, but what can we say about supply? Especially the one in circulation and made available for sale? Let's check
Exchange Reserves (BTC ed ETH)
Here we are talking about graphs relating to the offer and therefore to the amount of coins held on the exchanges
In this case we can see a gradual decrease over the past 3 years in the amount of coins held there.
The reduction in the supply held at the exchanges has decreased by 33% in 3 years, going from about 3 million to 2 million, with various significant decreases that have accompanied those of prices and in the last period due to the lawsuit filed by the SEC against Binance and Coinbase.
At this rate, one could calculate that if the reduction in supply were to be of equal strength in the next few years, it would take no more than 6 years before finding oneself without a stable circulating offer on the exchanges, which would therefore lead the price to a considerable increase precisely thanks to the constant demand and lack of supply able to satisfy this demand, which as we have seen, is persistent.
The same is true for Ethereum which in the last 3 years has seen a 50% decrease in its supply which resides at the exchanges. For Ethereum, another 3 years at this withdrawal rate would be enough to find itself in the same supply shock situation, as it is defined in technical jargon.
So we have a constant demand and a continuous decrease in the circulating supply, of which we know from historical data that 80% of the coins withdrawn from exchanges end up being held for more than 6 months and up to more than 60% for more than one year (even more bullish).
But what do the miners say about it? Let's go see them too
Miners Reserves
Here we have the Bitcoin reserves held by miners, in this case we take a monthly average to make the graph more readable.
As you can see, the increase in the supply of miners occurs during prolonged periods of price increases, as fewer and fewer Bitcoins have to be sold to meet the management costs of the mining farms, and vice versa in bear markets.
What we are interested to note however is that the supply has not changed much in the last 3 years, remaining almost unchanged and moving 20k Bitcoin up and down and now standing at levels even higher than when we broke the ATH last year cycle.
For miners, therefore, not much seems to have changed, as they are used to bull and bear markets.
This clearly also confirms their willingness to continue holding the asset in the long term.
Another thing we can notice is the increase that took place in the last period, partly due to the increase in prices, but equally due to the increase in fees generated by the protocol of ordinals and therefore by the use of the network.
Speaking of using the network, let's now see the active users, what do you say?
Active addresses
The active addresses, or active addresses, signal to us an increase or decrease in the addresses that are activated daily by sending at least one transaction.
As we can see, daily active addresses smoothed from a 30-day average have been on the increase in the last period reaching new highs for two years, i.e. after the declines in prices from the first ATH in 2021 to the bottom of the summer of the same year and in any case higher than the hype periods when we broke the old ATH at 20k.
This is just another confirmation that the Bitcoin network is very far from dying and is still actively grinding transactions.
So after all that, how can you not be bullish in the long run?
Author
Joele Novelli - ChainLog
Socials:
Twitter - Telegram - Youtube - LinkedIn - Instagram - Newsletter - TikTok
(All opinions expressed above are the author's personal opinions and should not form a basis for making any investment decisions, nor should they be construed as a recommendation or advice to engage in any investment transaction.)


Great article!