

Smart money - A whales and humpbacks study case
15th of May 2023

Joele Novelli
Twitter: https://twitter.com/ChainLogAnalyst
Telegramma: https://t.me/ChainLogAlphaGroup
Youtube: https://www.youtube.com/@chainlog9504
Linkedin: https://www.linkedin.com/in/joele-novelli-531101248/
Instagram: https://www.instagram.com/chainlog_ig/
Newsletter: https://chainlognewsletter.substack.com/
TikTok: https://www.tiktok.com/@chainlog
Good morning everyone
Today we are here to talk once again about onchain analytics.
For today's article I have chosen 6 charts that are specifically aimed at analyzing whales in search of any bullish or bearish signals, but above all for an analysis regarding the "smart money" phenomenon
Twitter podcast on the same topic: https://twitter.com/i/spaces/1YqKDoBnjADxV?s=20
Or a Youtube video here:
So today we will talk about:
Address Bands Distribution
Address Bands Realized Price
Address Bands Cost Basis Distribution
Whales Address Bands Balance
Whale SUP
Whale Accumulation Heatmap
But let's not waste any more time and immediately get into the merits of onchain analysis
Address Bands Distribution
Address Bands Distribution is an onchain metric that allows us to see which hodler category holds which amount of BTC in %
In this case we look at the % of whales and humpbacks, i.e. 1k to 10k and 10k and beyond BTC
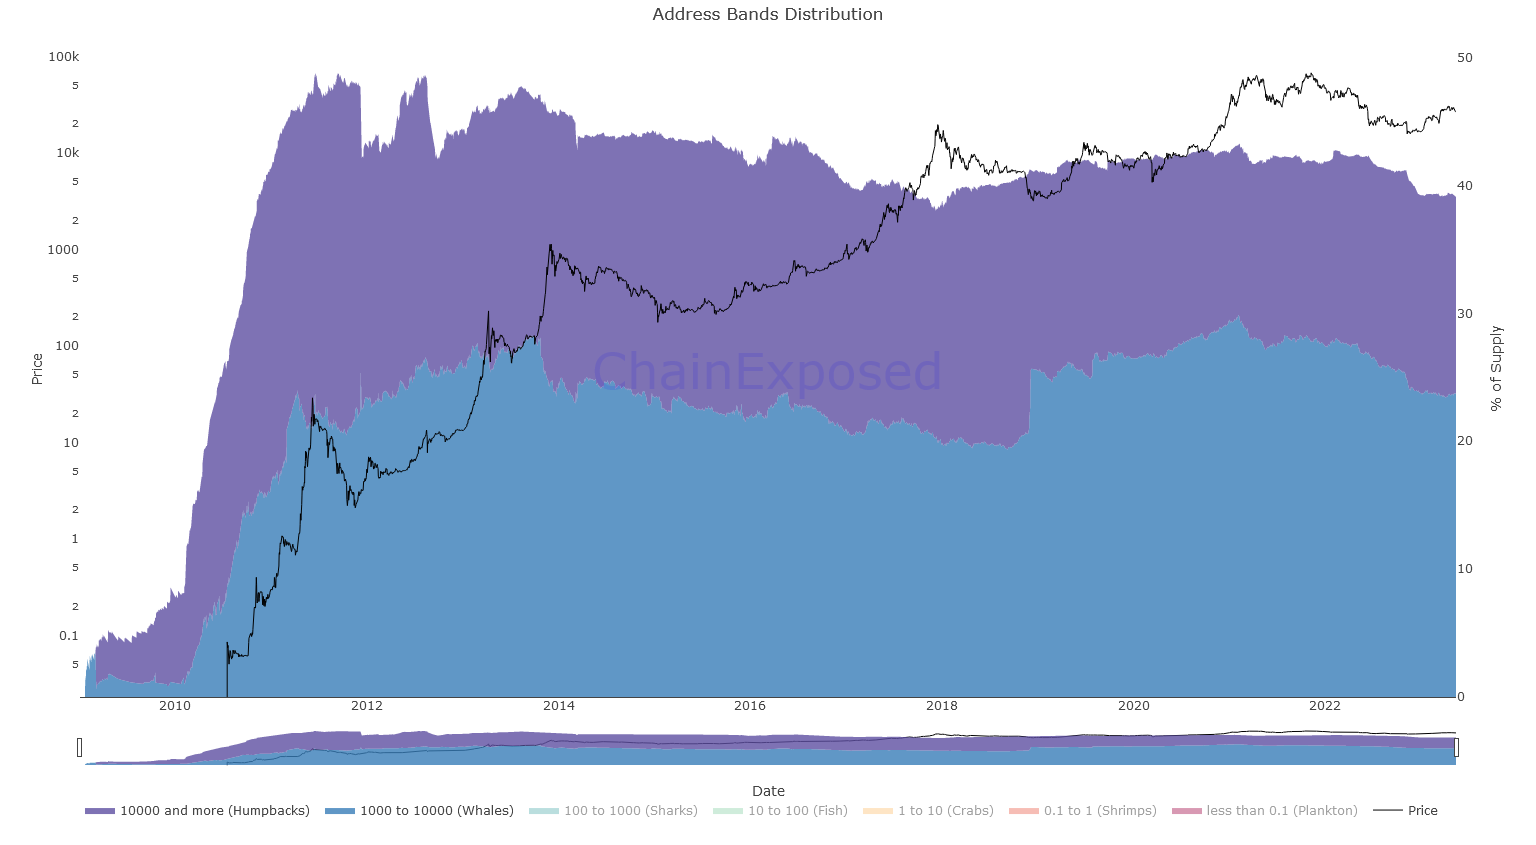
As you can see, these two categories of hodlers alone hold almost 40% of the BTC supply with whales currently holding 23.75% while humpbacks hold 15.40%
Is there anything to worry about? Clearly not
Whales have always shown a tendency to decrease their exposure to high risk assets from the top of bull markets to the bottom of bear markets, to cash in dark times.
Address Bands Realized Price
Address Bands Realized Price is the onchain metric that allows us to see the average onchain cost for certain hodler categories
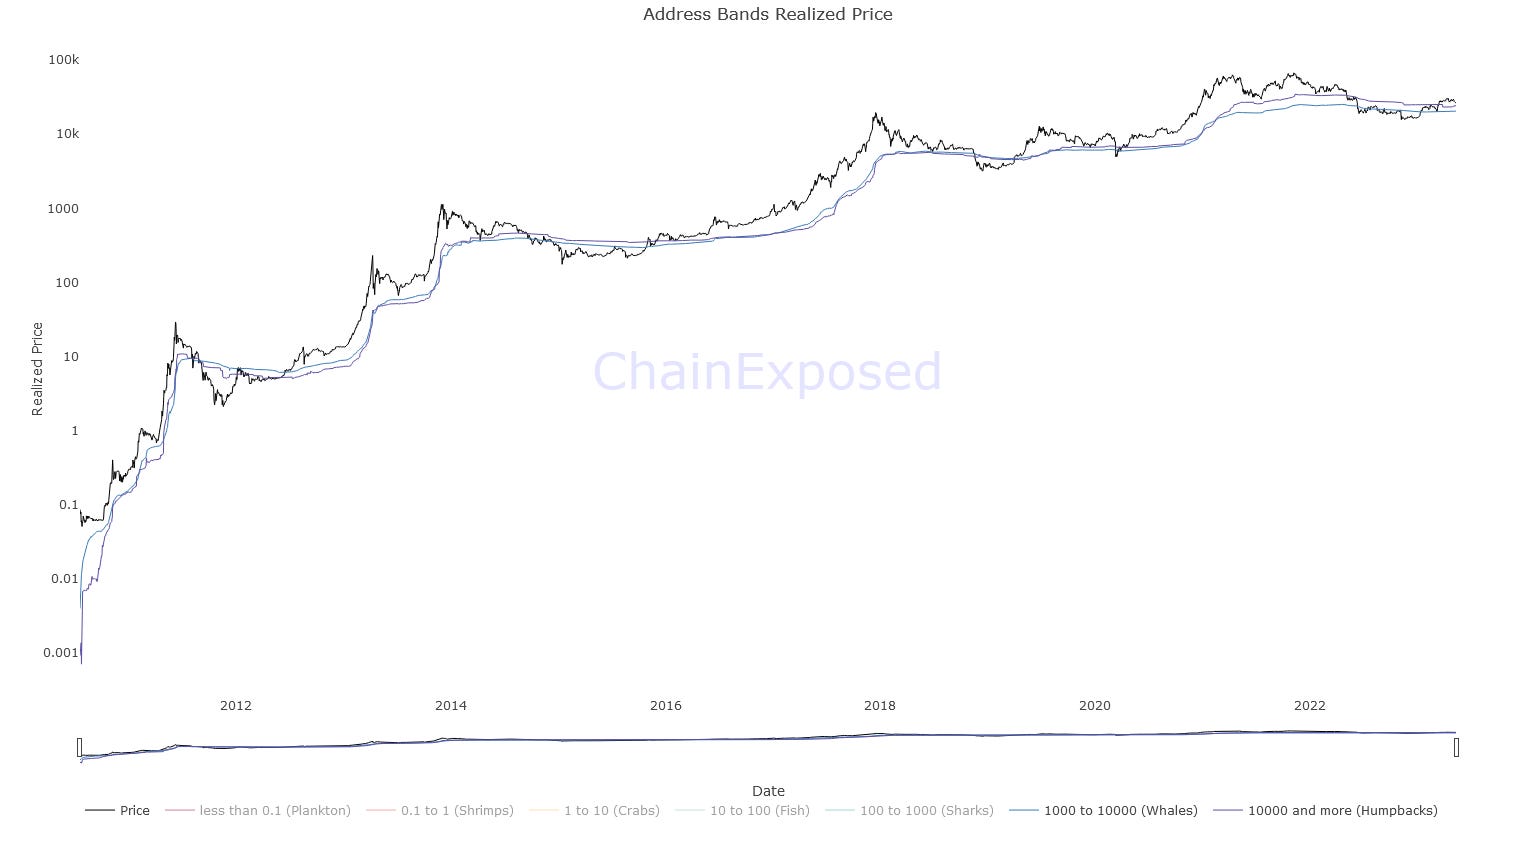
In this case we can observe how the basic cost of the whales is currently around 20.5k, while that of the humpbacks is around 24.2k
In my opinion, there are still lines on which to take a long-term position. You can see why for yourself, as there have always been more or less dividing lines between bull and bear markets
Address Bands Cost Basis Distribution
Address Bands Cost Basis Distribution is an onchain metric that allows us to understand to what extent the various categories of hodlers have accumulated
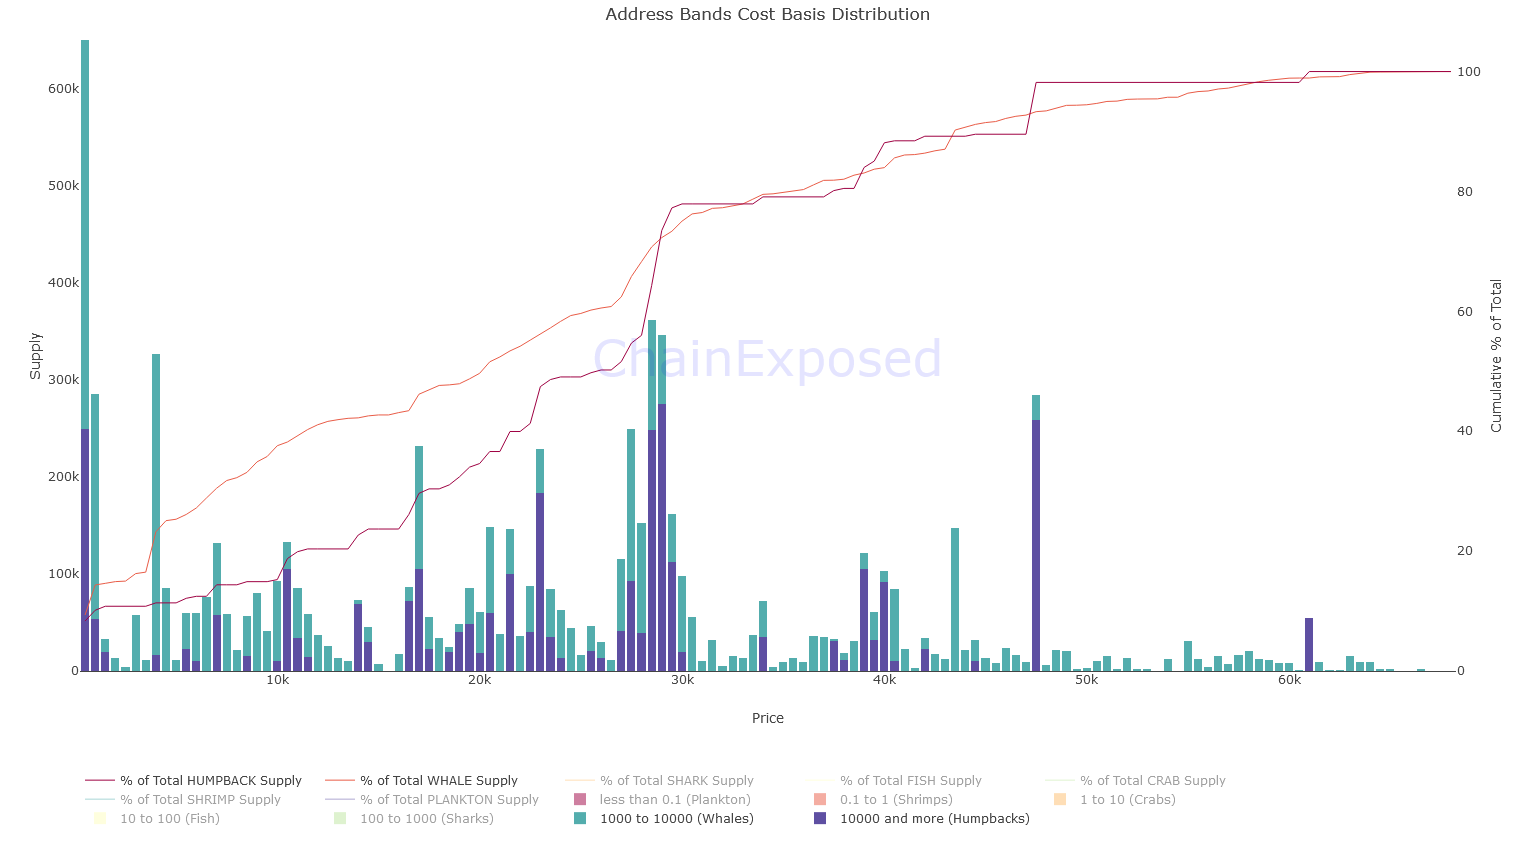
In this case we can see that most of the whales and humpbacks have accumulated more at 17, 23 and then again from 27 to 30k, with a single peak at 47.5k, probably related to a single entity or at most to a pair
So watch out for these price levels
Whales Address Bands Balance
Whales Address Bands Balance is an onchain metric that allows us to understand how many BTCs are held in whale wallets
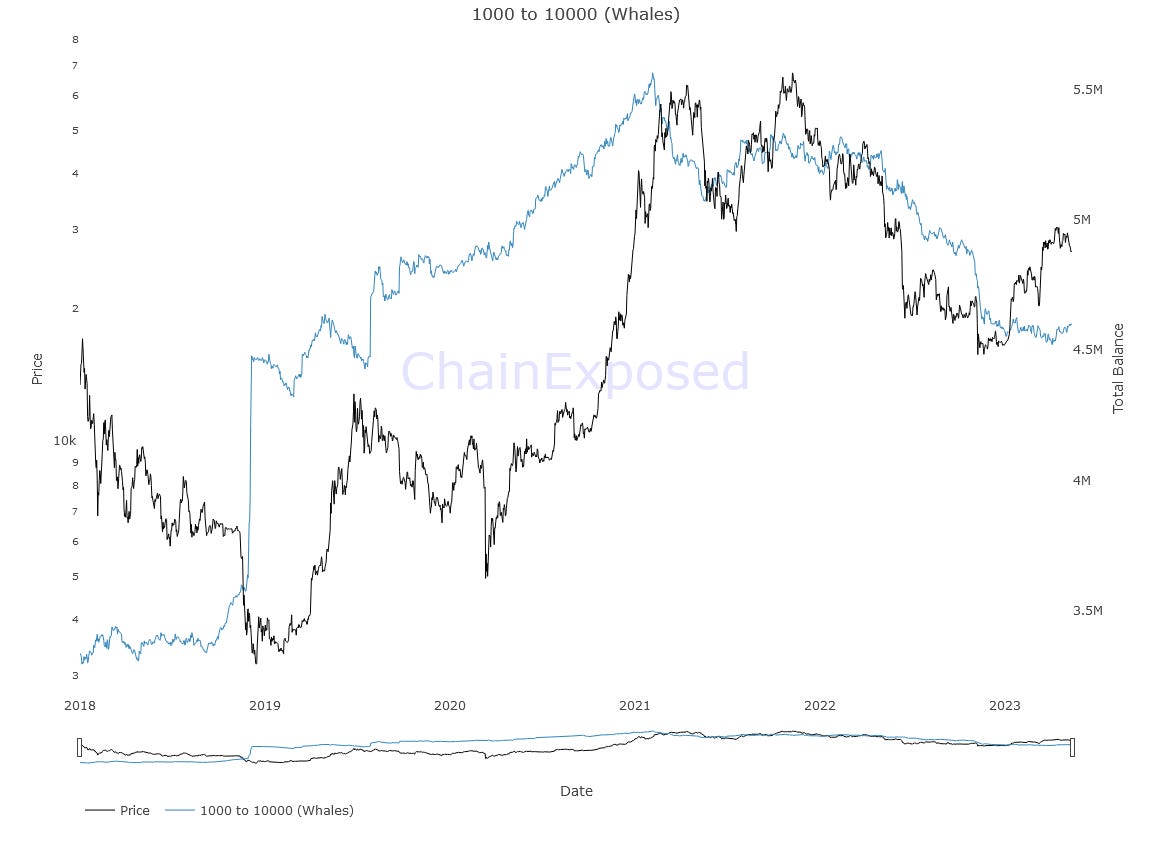
In this case they have the confirmation of the first graph. The whales have begun to distribute from the top up to the bottom of the bear market, where we see a downward peak, actually to be considered as an advancement to the higher hodler category, i.e. the humpbacks as we see below
You can in fact see an increase of the same magnitude as soon as you enter the last leg directed at 16k
Whale SOPR
Whale SOPR is an onchain metric that allows us to understand the level of profitability, i.e. the "x" level of profit or loss that would be realized by the category if they sold at that moment
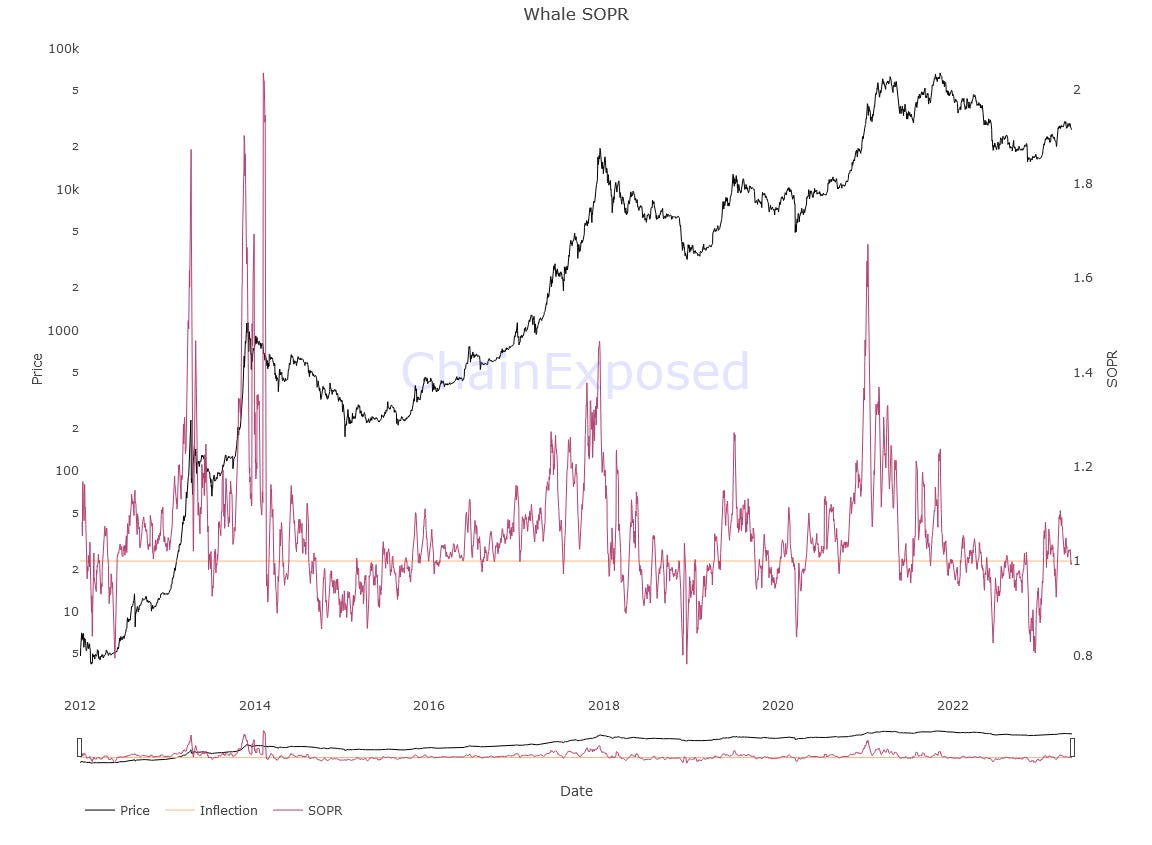
Here we see how the value has just returned to 1, which would be the break-even point, or break-even point, making the current price a good point to re-enter or exit at parity.
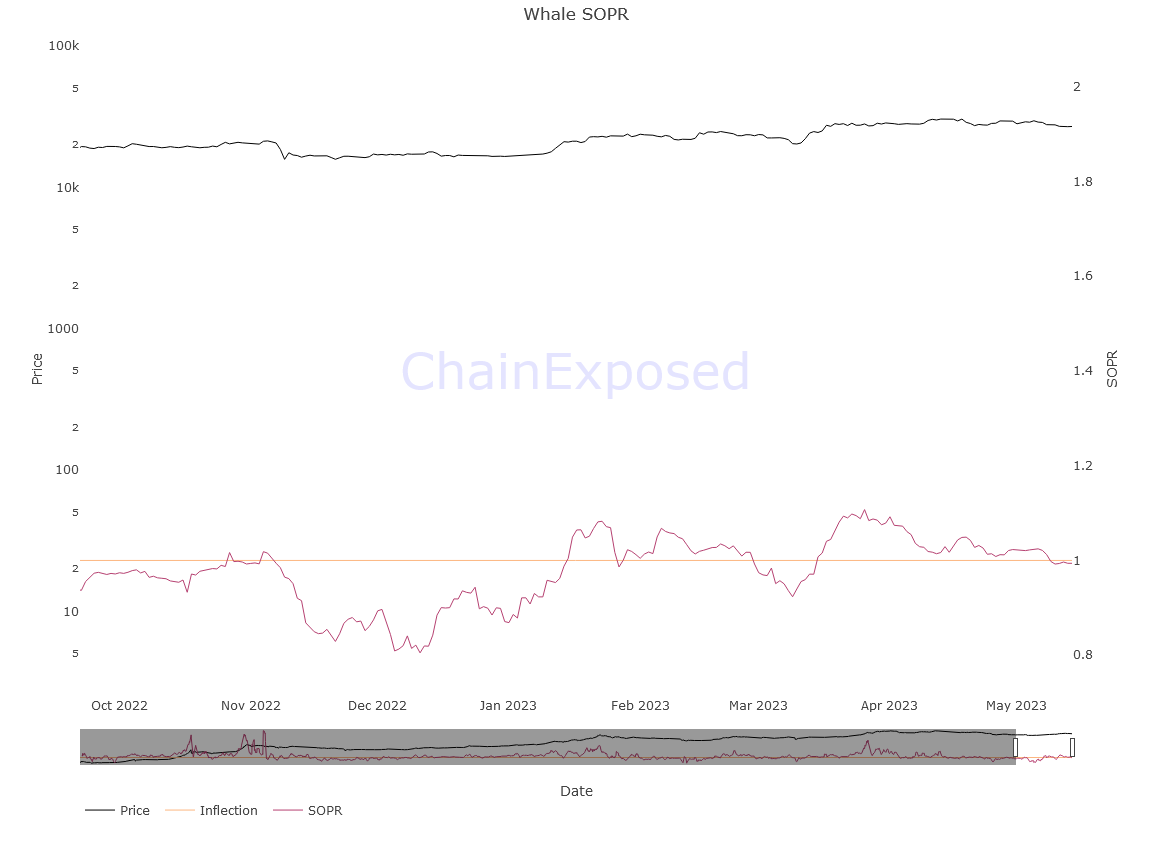
If the first case were to occur we could soon find ourselves in another upward spiral and vice versa in the second.
The fact is that there is no bull market without this category maintaining itself for a long time with profitability levels above 1, returning once it returns to the break-even point for higher levels of after-effects profit
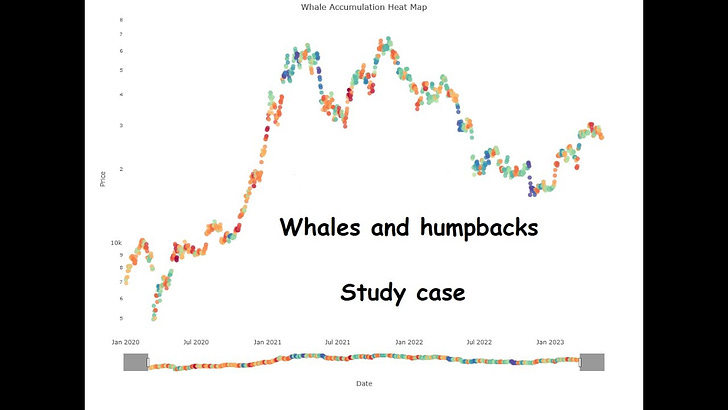
Whale Accumulation Heatmap
Whale accumulation heatmap is an onchain metric that allows us to understand when whales are accumulating (warm colors) and when they are distributing (cool colors)
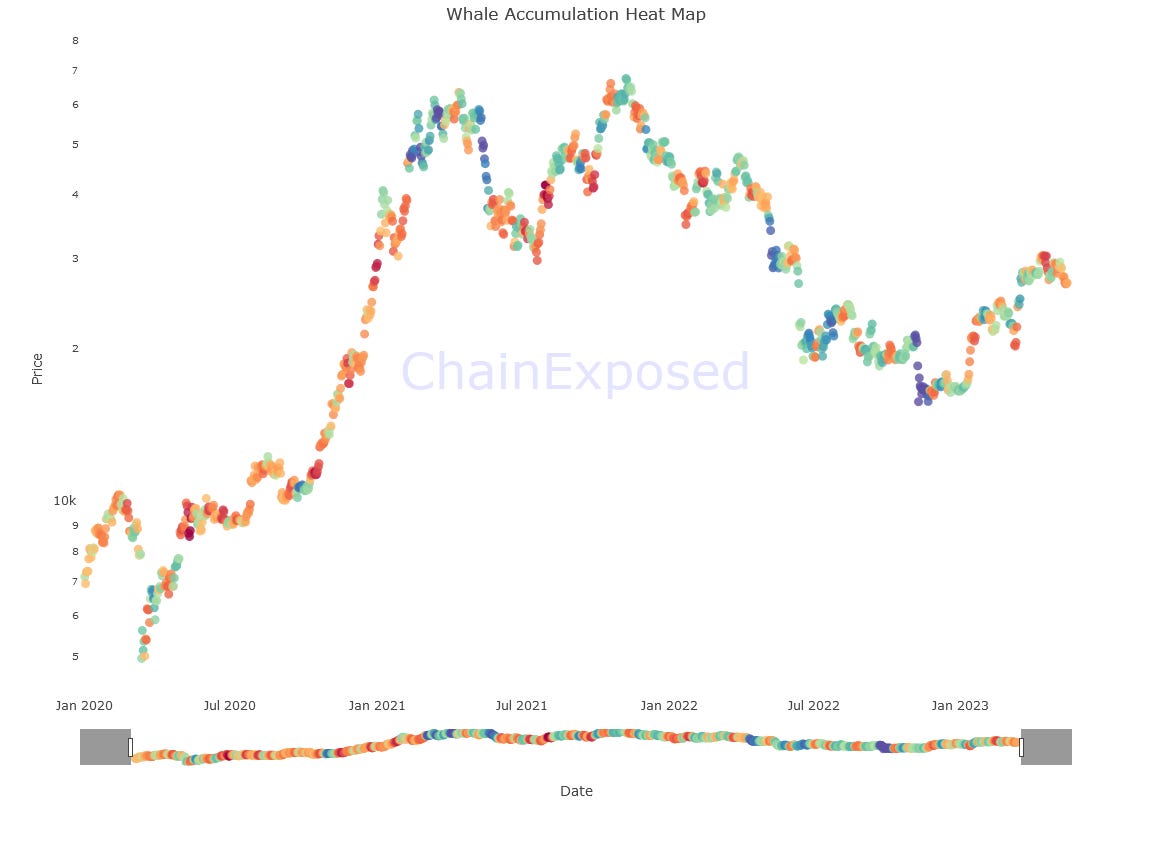
In this case we can see that it is roughly always the whales that push the market up, while they are always the ones that largely push it down, although there are small inaccuracies given by the very small and small number of such entities in the market.
In fact, a single entity will tend to tip the balance a lot by aggressively accumulating
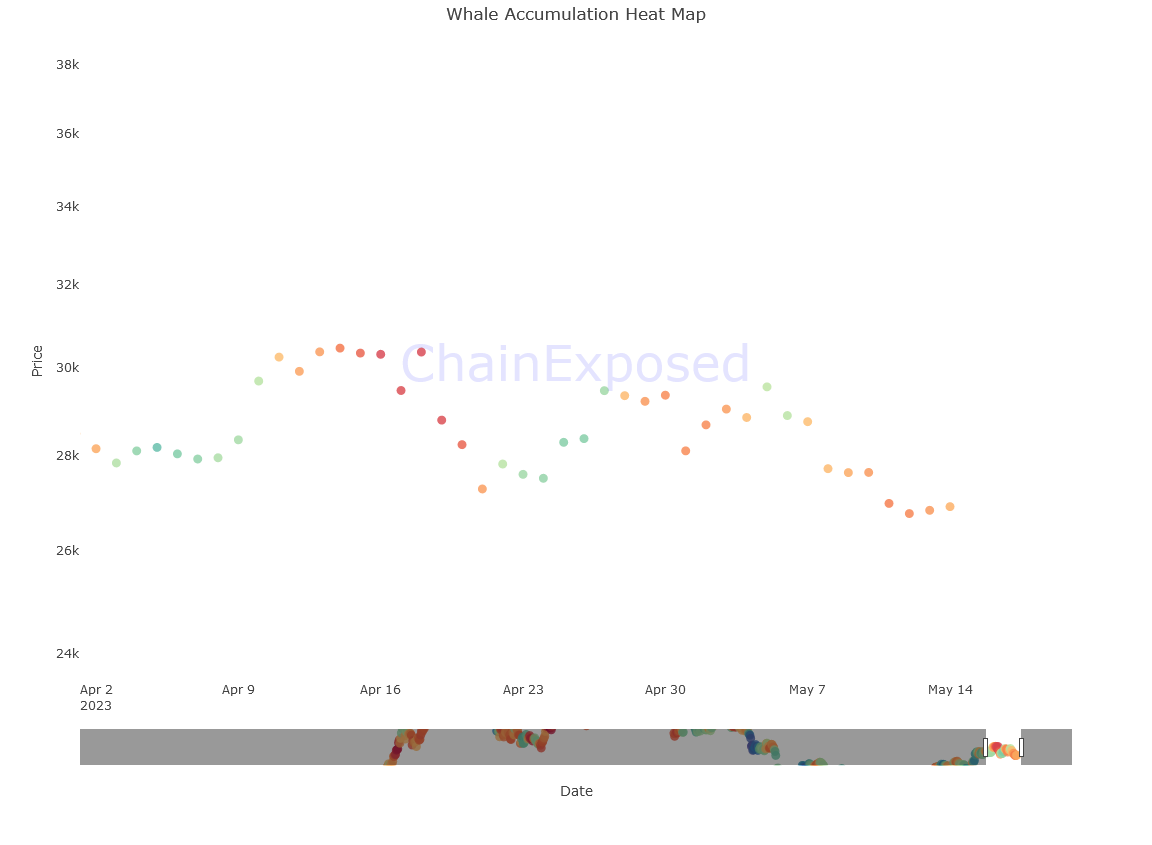
Finally, here we can see that in the last few days the whales seem to accumulate slightly, which if combined with the whale SOPR can clarify the intent of the whales at the break-even point, i.e. to return to the market for a next leg up.
Here ends my analysis, but we will meet again soon.
As always, greetings to all and much prosperity!
(All opinions expressed above are the author's personal opinions and should not form a basis for making any investment decisions, nor should they be construed as a recommendation or advice for engaging in any investment transaction.)