Author:
Joele Novelli
Socials:
Twitter: https://twitter.com/ChainLogAnalyst
Telegram: https://t.me/ChainLogAlphaGroup
Youtube: https://www.youtube.com/@chainlog9504
LinkedIn: https://www.linkedin.com/in/joele-novelli-531101248/
Instagram: https://www.instagram.com/chainlog_ig/
TikTok: https://www.tiktok.com/@chainlog
Newsletter:
Good morning everyone
Today we are here to talk once again about onchain analytics.
For today's article I have chosen 5 charts that are specifically aimed at analyzing transactions in search of any bullish or bearish signals, but above all for an analysis regarding the phenomenon of ordinals, NFTs on the Bitcoin Blockchain (BRC20) and what it can result
You can find the full version of my thoughts on the issue on Twitter:
https://twitter.com/ChainLogAnalyst/status/1655595558117990400?s=20
Or on Youtube here:
In any case this is not all because there is an extra that concerns ETH and the movement of thousands of coins by the Ethereum foundation at the end
So go all the way, you won't regret it.
So today we will talk about:
Transaction Fees
Transaction Count Bands (Absolute and Relative)
Transacted volume and average transaction volume
Transaction volume bands (Relative)
Extras: Ethereum foundation moving coins
But let's not waste any more time and immediately get into the merits of onchain analysis
Transaction Fees
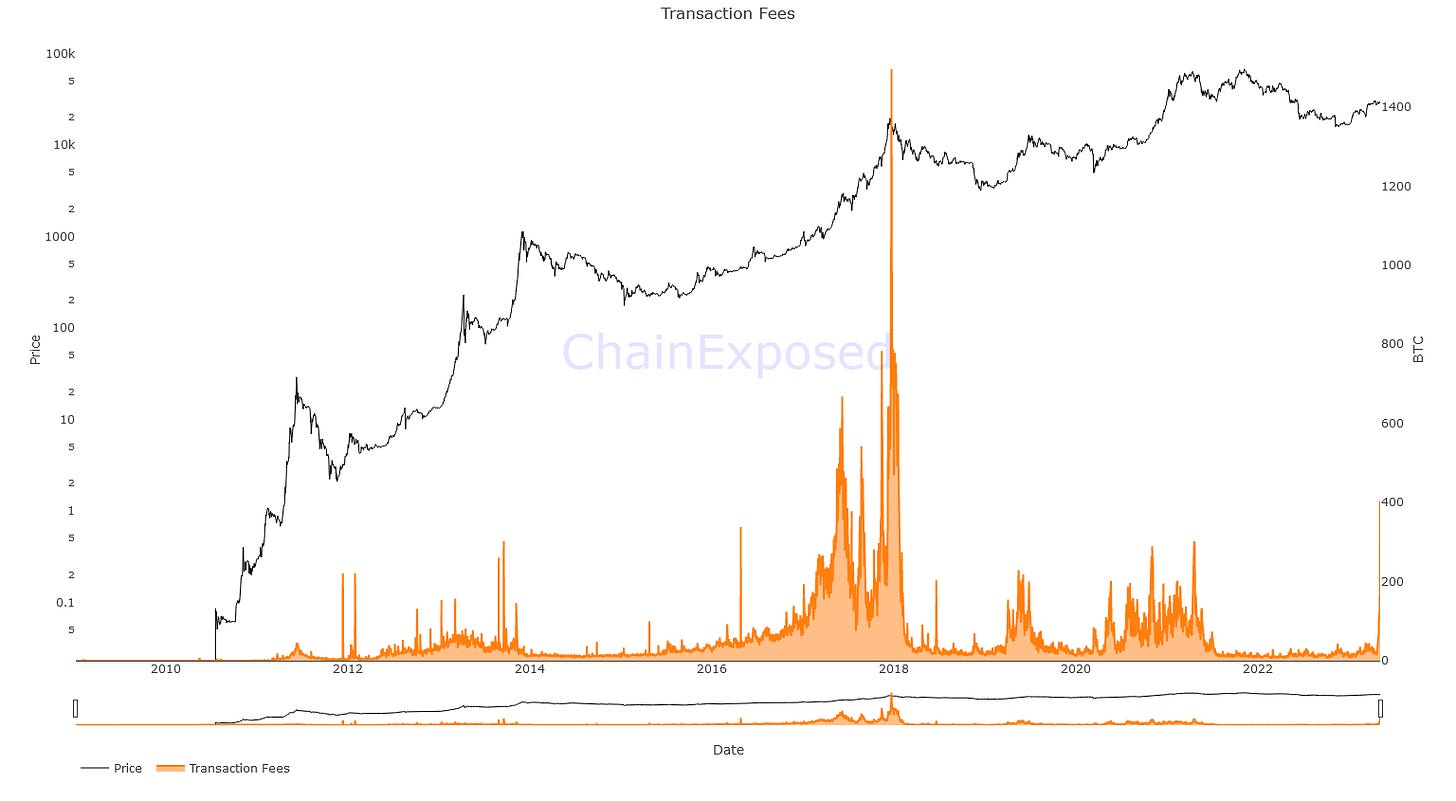
The graph I don't think needs much explanation. On the right, the number of Bitcoins spent on fees, to date more than 400, which at the current price of 27.5k would correspond to around 11 million in a single day, the highest figure since the 2017 bull market peak
This is simply due to a massive transaction request for hash registration within the BTC circuit, which would correspond to a resalable NFT on the blockchain.
These NFTs, whose standard is that of the BRC20, are the ordinals, brought to light by Stacks, whose token is STX.
This, as you will be able to hear in the live shows, in my opinion, is one of the most bullish things that has ever happened for Bitcoin. Something that could really change everything.
Transaction Count Bands (Absolute and Relative)
In any case we are talking about the Transaction Count Bands, both in absolute value and in percentage value, as regards the bands divided into the amount of Bitcoins per transaction
In the case of the value in terms of USD, i.e. the absolute, we can see for ourselves that most of the transactions that take place today on the Bitcoin network almost exclusively involve transactions below 0.1 BTC, and that in the last day have transacted coins for a value close to half a million, less than one twentieth of the fees paid to miners for validating transactions
Same thing on the side of this graph, with the only difference that here we can see how in fact the amount of transactions below 0.1 BTC reached 88.5% of the total transactions, with transactions above 10BTC practically non-existent, as is obvious be it then
Transacted volume and average transaction volume
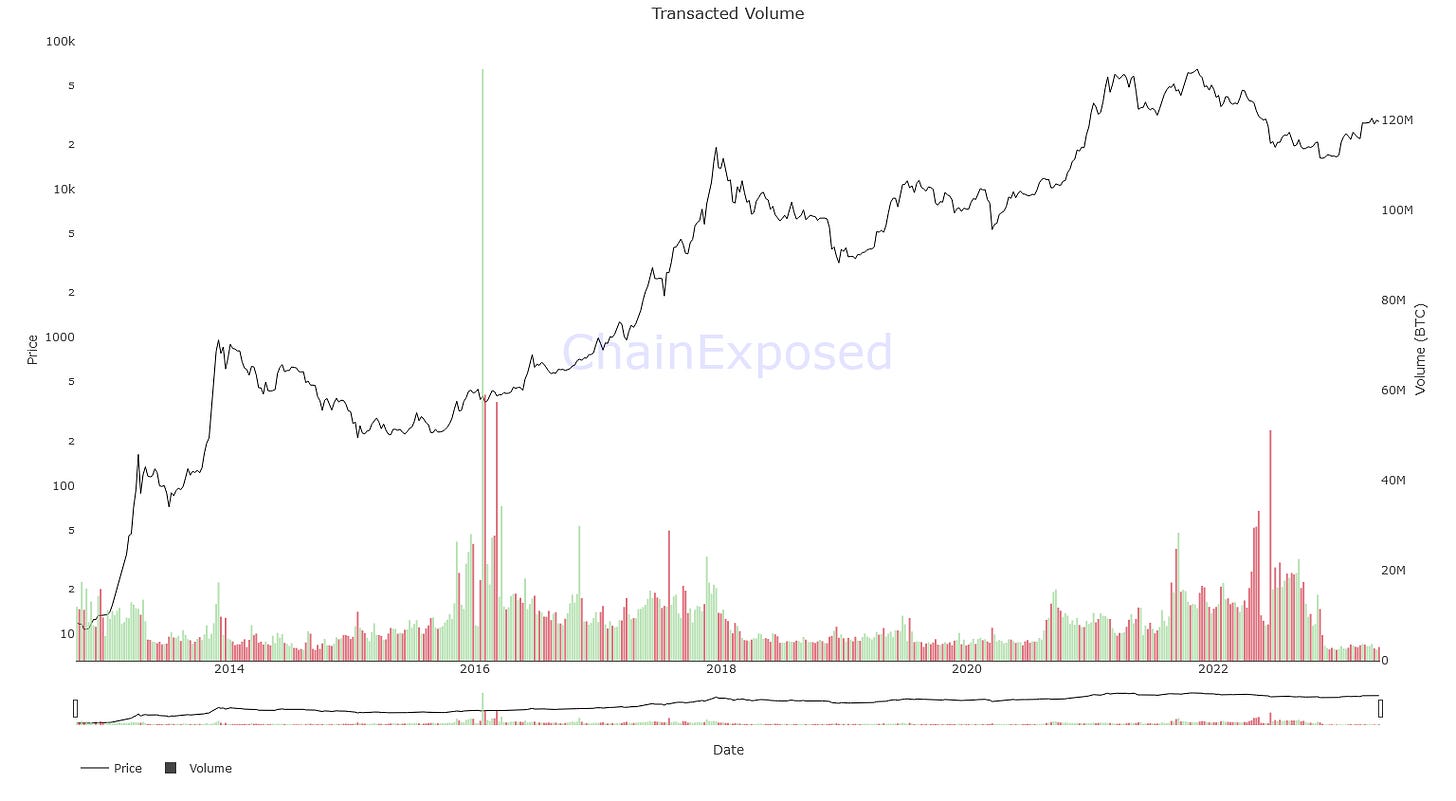
If before we were talking about the number of transactions, here we are talking about volume, therefore about the amount of BTC moved in these transactions, and here we find an initial confirmation.
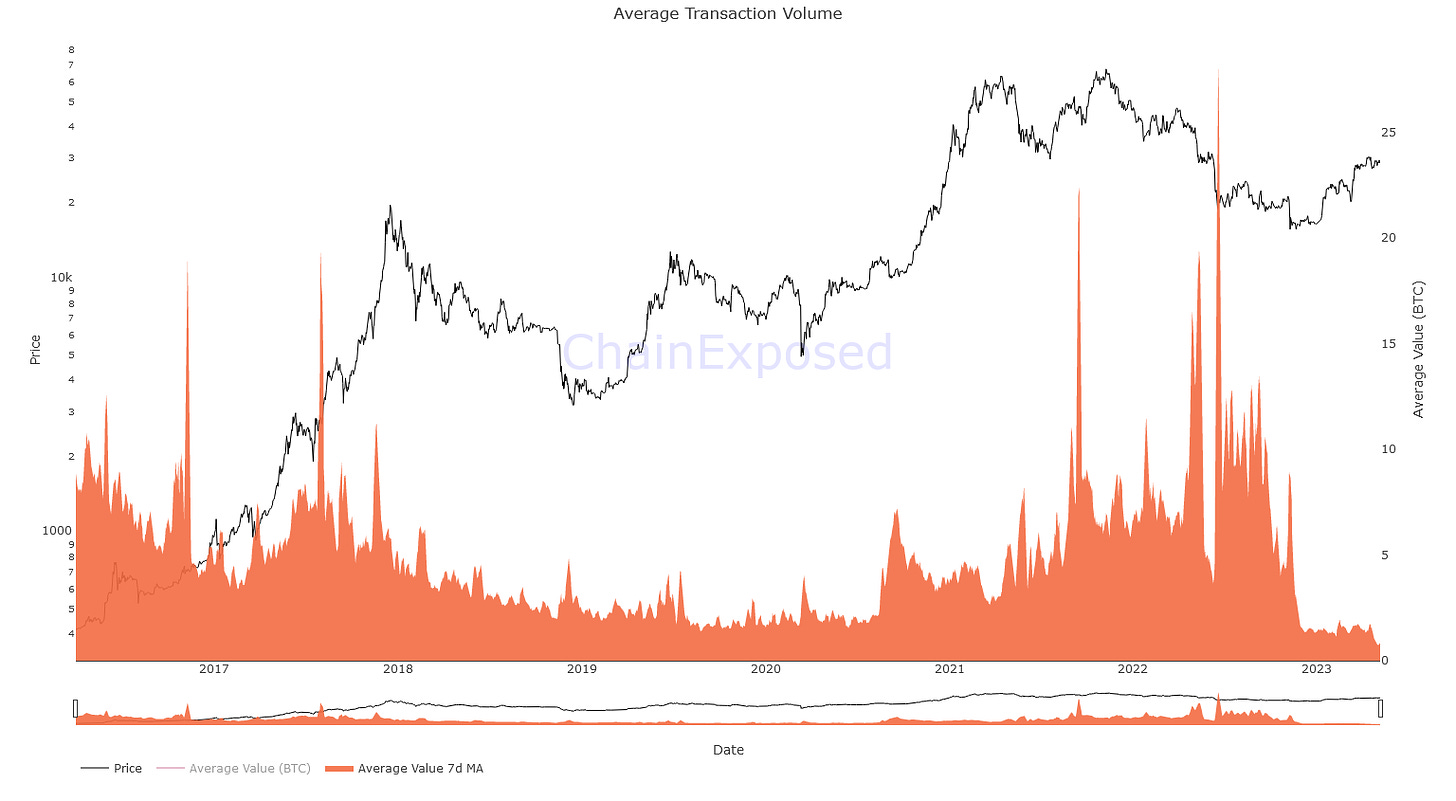
The volume transacted is at the lowest levels in the entire history of BTC, which leads us to think that in addition to the phenomenon of ordinals, the chain is practically unused to transfer BTC and that they are mostly used as a store of value all 'inside some wallet that ages from year to year.
I repeat, there is nothing more bullish than what has happened lately with ordinals, for the security of the network in the future, but also for the investments deriving from greater use and profitability of the network
In any case, we have a second confirmation from the 7-day average volume transacted, also at historic lows, which has risen significantly after the various collapses of decentralized and centralized entities that have led Bitcoin to fall in value over the last few months
Transaction volume bands (Relative)
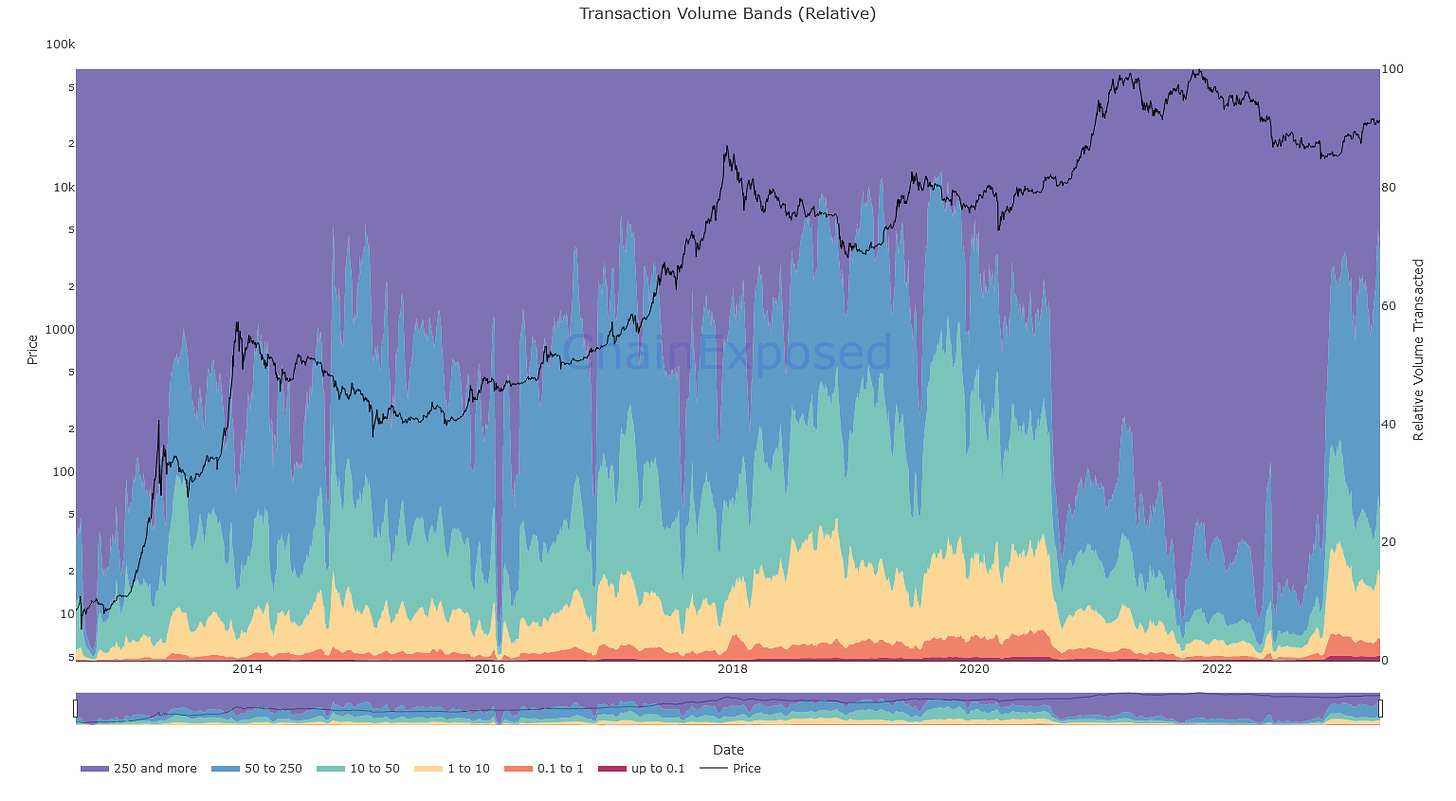
The last graph concerning the transactions is the one concerning the bands by number of Bitcoins transacted, poured onto the graph as a percentage of the total transactions
Here too it can be noted that after the collapse of the various protocols and centralized entities, the amount of onchain movements involving transactions with a volume exceeding 250 BTC, as a percentage of the total volume moved, have drastically decreased, going from peaks of 92.5% to highs of 42%, while 0.1 BTC transactions went from lows of 0.02% of total volume transacted to today's highs of 0.87%, a 43.5x increase.
Extras: Ethereum foundation moving coins
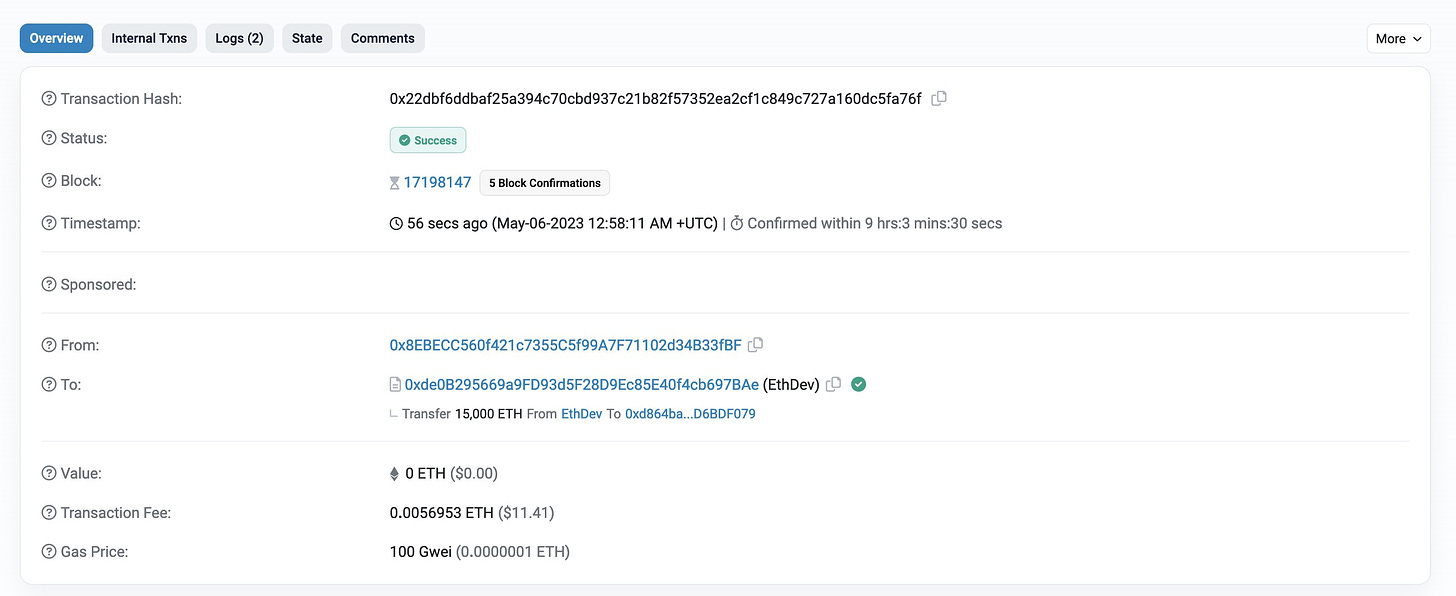
Here we are finally talking about the Ethereum Foundation moving 15k coins to an address that is now empty
This was reported by:
https://twitter.com/HsakaTrades/status/1654652138310574083?s=20
and that he's already sent everything to Kraken
I would like to point out that at the time of the transaction, the total value of the possible sell pressure would have amounted to 2k per single ETH, bringing the total to approximately $30 millions
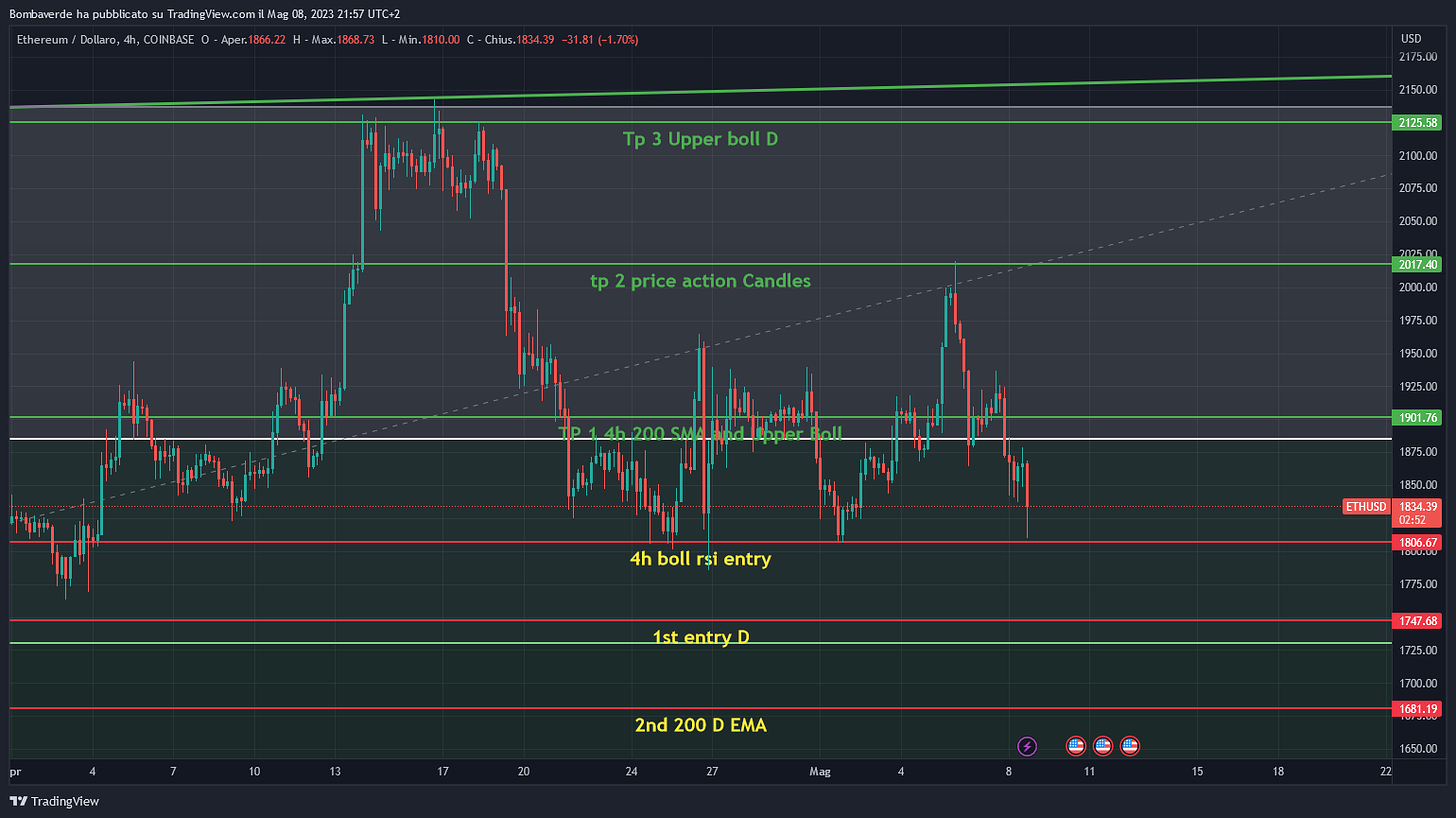
this happened 2 days ago, before the price drop
which as you can see brought just 4 dollars from my first entry, placed here live: https://www.youtube.com/live/MxrypmTvHco?feature=share
As I tried to teach even in the live one, usually the entries are placed just above the designated entry to be sure to enter when you want because the buyers all use this strategy and those who place themselves exactly in support risk being left out , anyway... let's go back to the onchain analysis
Another boy (https://twitter.com/timoharings/status/1654758213550501890?s=20)
then placed everything on the graph, and here is the result:
- 30,000 ETH on the 12th of March 2021
- 36,000 ETH was on the 21st of May 2021
- 20,000 ETH on November 11th 2021
Essentially, 5 times out of 8, the movement of coins by the Ethereum Foundation has led to a drop in prices or in any case to a temporary and local top
In my opinion, however, it is too simplistic to think that a single movement brings about a substantial drop in prices without counting the trend of Bitcoin, dominance, the dollar and any other possible correlation, including news and other types of analysis.
In any case, stay alert, whales and humpbacks are the fish species that move the market these days, as they always do.
If you want to know more about the previous metrics, I talked about them, in English, in my last Youtube live:
Here ends my analysis, but we will meet again soon.
As always, greetings to all and much prosperity!
(All opinions expressed above are the author's personal opinions and should not form a basis for making any investment decisions, nor should they be construed as a recommendation or advice for engaging in any investment transaction.)


