

Young and old hodlers, a case study on SOPRs and Realized prices
Young and old hodlers, a case study on SOPRs and Realized prices
Joele Novelli - 23th May 2023

Socials:
Twitter - Telegram - Youtube - LinkedIn - Instagram - Newsletter - TikTok
Introduction
Today we are here to talk once again about onchain analysis
Hi everyone!
Time for #market analysis #Number30!
"Young and old hodlers, a case study on SOPRs and Realized prices"
For today's article I have chosen 6 graphs that are aimed at analyzing the onchain cost basis and the profitability of the hodlers divided according to the holding time to evaluate who and how moved and continues to move the market, so as to being able to trade using them
You can find the full version of my thoughts on the issue on Twitter:
https://twitter.com/ChainLogAnalyst/status/1661073764434493448?s=20
Or on
TOday we are gonna talk about:
Young Cumulative Bands SOPR and Realized Price
Old Cumulative Bands SOPR and Realized Price
Isolated Age Bands SOPR and Realized Price
But let's not waste any more time and immediately get into the merits of onchain analysis
General description of the metrics
In this case we are talking about two different metrics, but related to the same way of division of the hodlers, namely that of time.
As far as the SOPR is concerned, we are talking about market profitability, i.e. the profit or loss not yet realized and the amount "x" that each category would realize if it were to sell.
As far as the realized price is concerned, we are talking about the basic on-chain cost for each category of hodlers, which could turn into support or resistance as the price approaches from various directions.
But let's see everything in detail
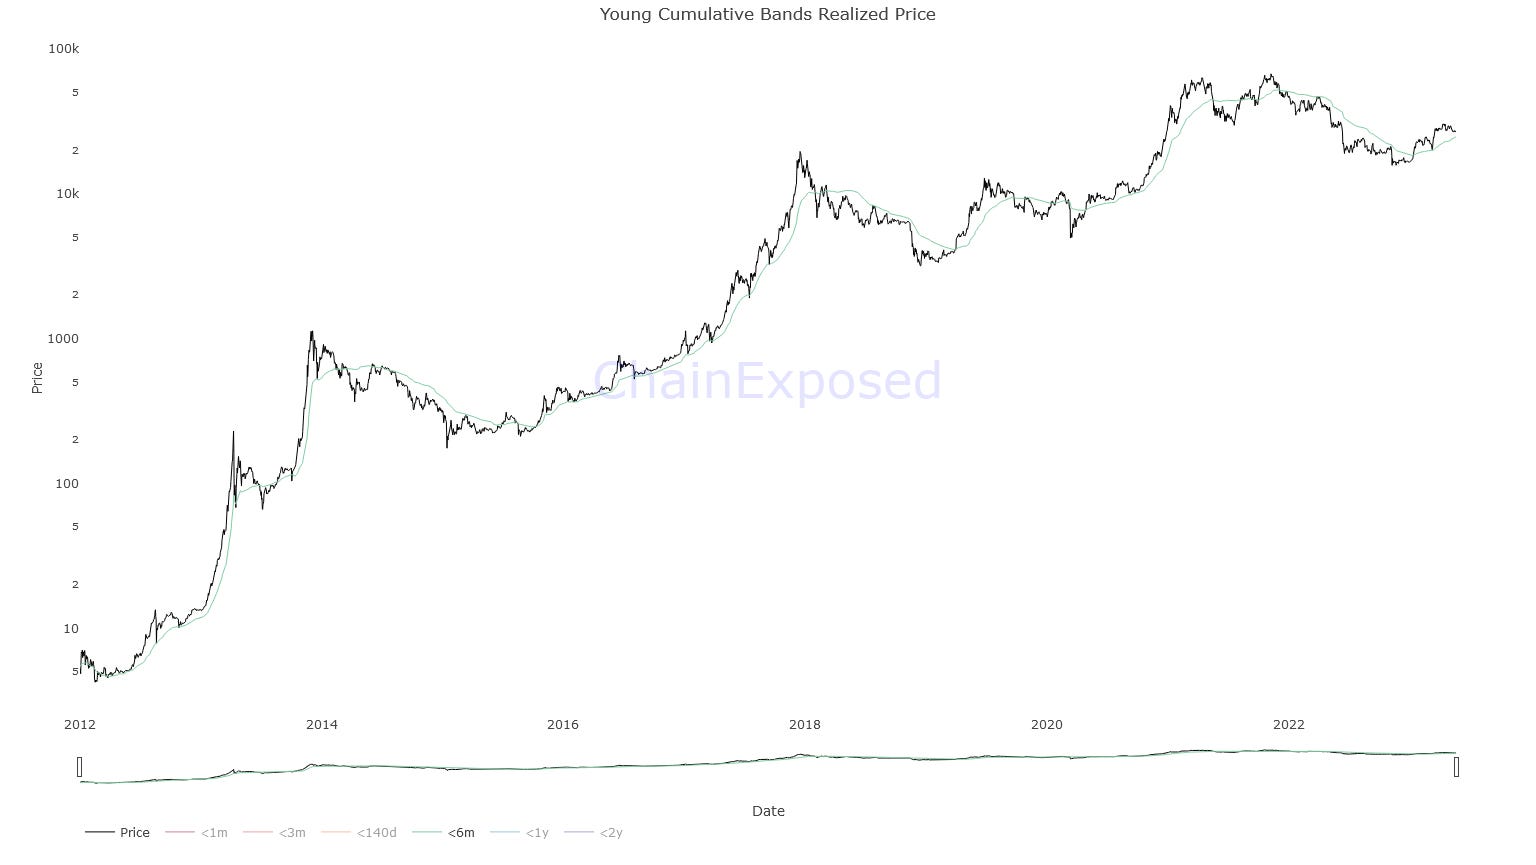
Young Cumulative Bands SOPR and Realized Price
Young cumulative bands is an onchain metric that takes into account hodlers who have held the asset up to a certain period.
In this case we are talking about hodlers who have held the asset for a month or less, for 3 months or less, for 6 months or less, for a year or less and finally for 2 years or less, with the latter category taking into I also examine all the others of course
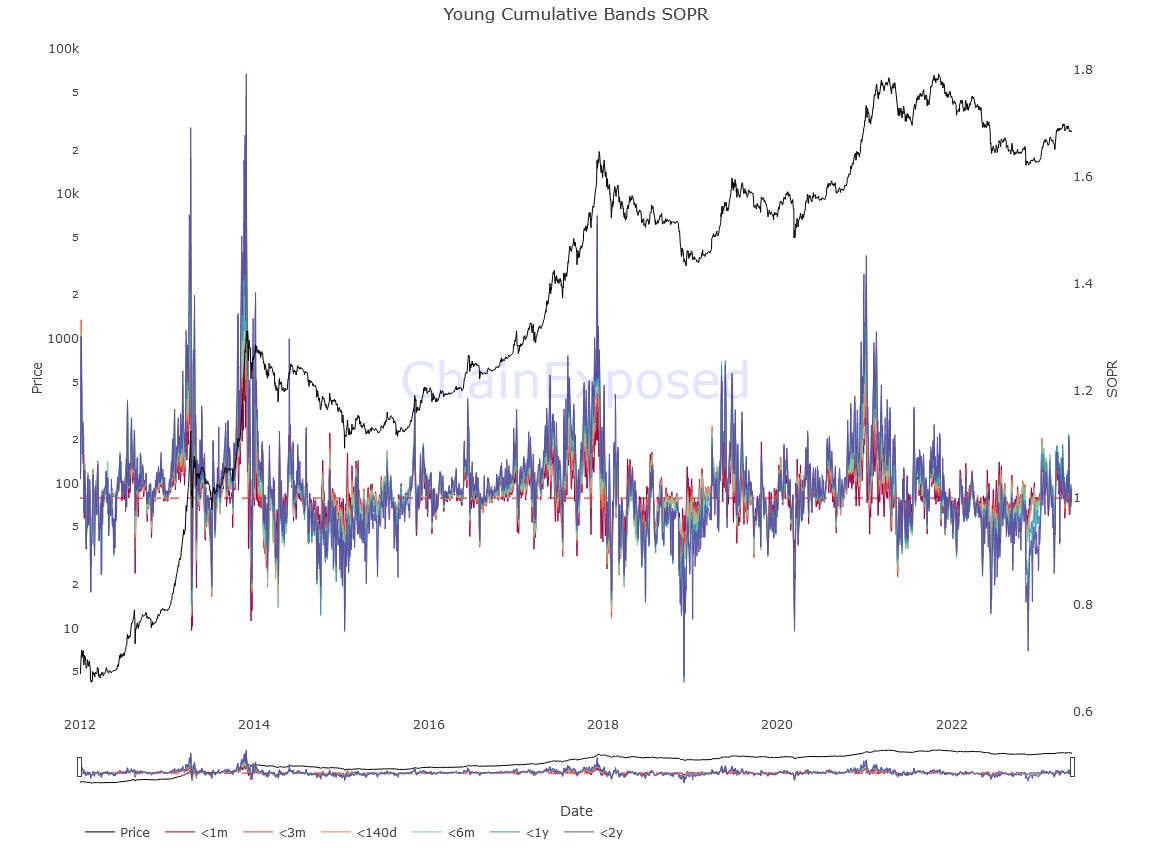
The graph above is obviously too noisy to analyze, so let's look at the different classes of hodlers one at a time to better identify the trends and patterns they form on the graph.
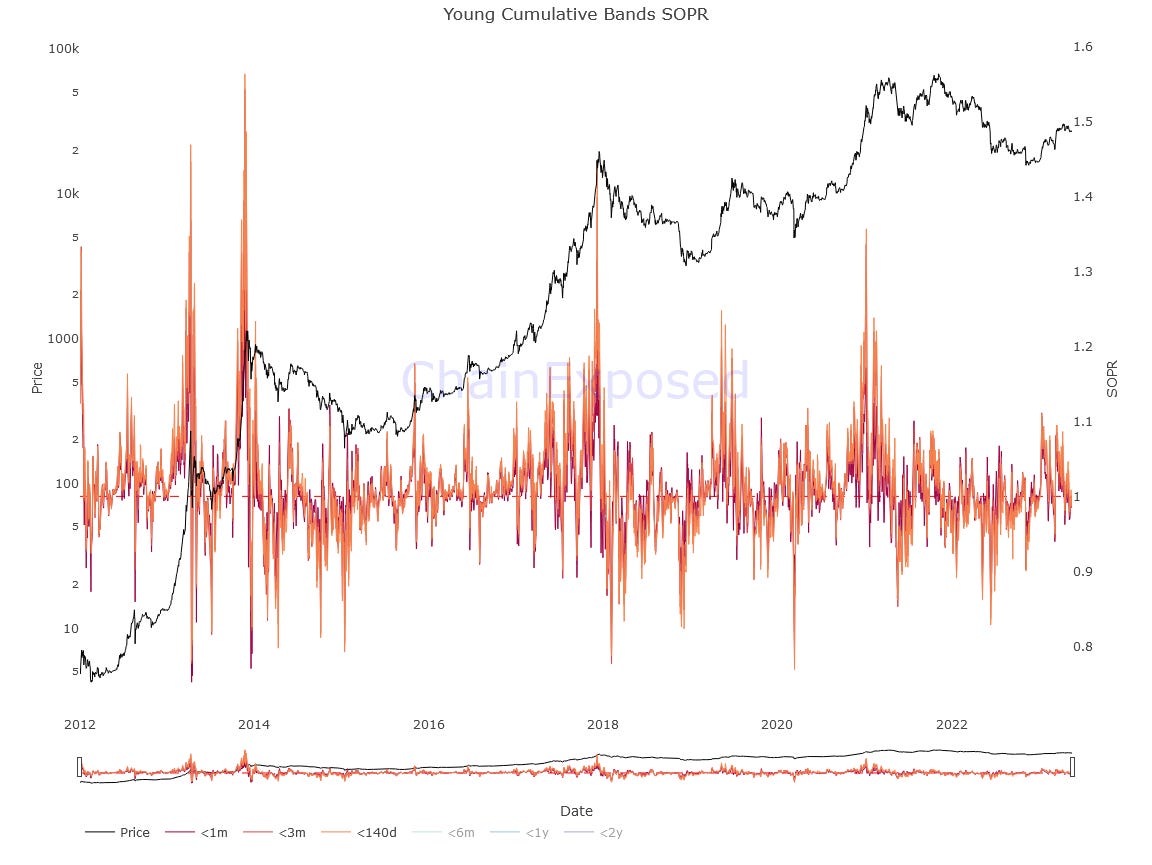
Taking into consideration the data we have relating to the SOPR of 140 days or less hodlers we can say that their data aggregate cannot be evaluated on the basis of a long-term price action but more than anything else it could be used for a short-term confluence with top and local bottoms.
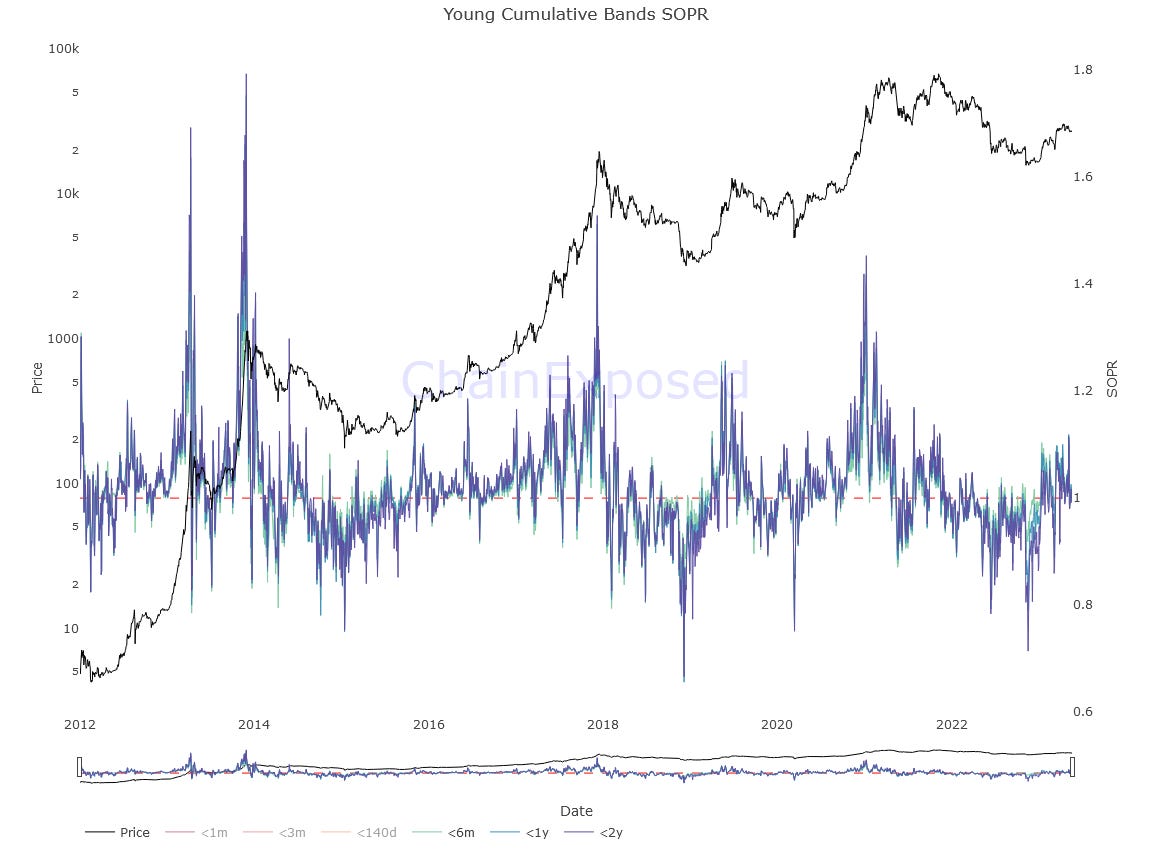
Then we move on where at 6 months or 1 year or less hodlers start to form a visible pattern that takes their overall profitability below their parity point in bear markets and way above them in bull markets.
Lately these values have indeed started to remain above 1 again, a symptom of a new beginning of the bull market or in any case of a bear market rally which in the long run, if the current level of prices and profitability is maintained, could lead us to that.
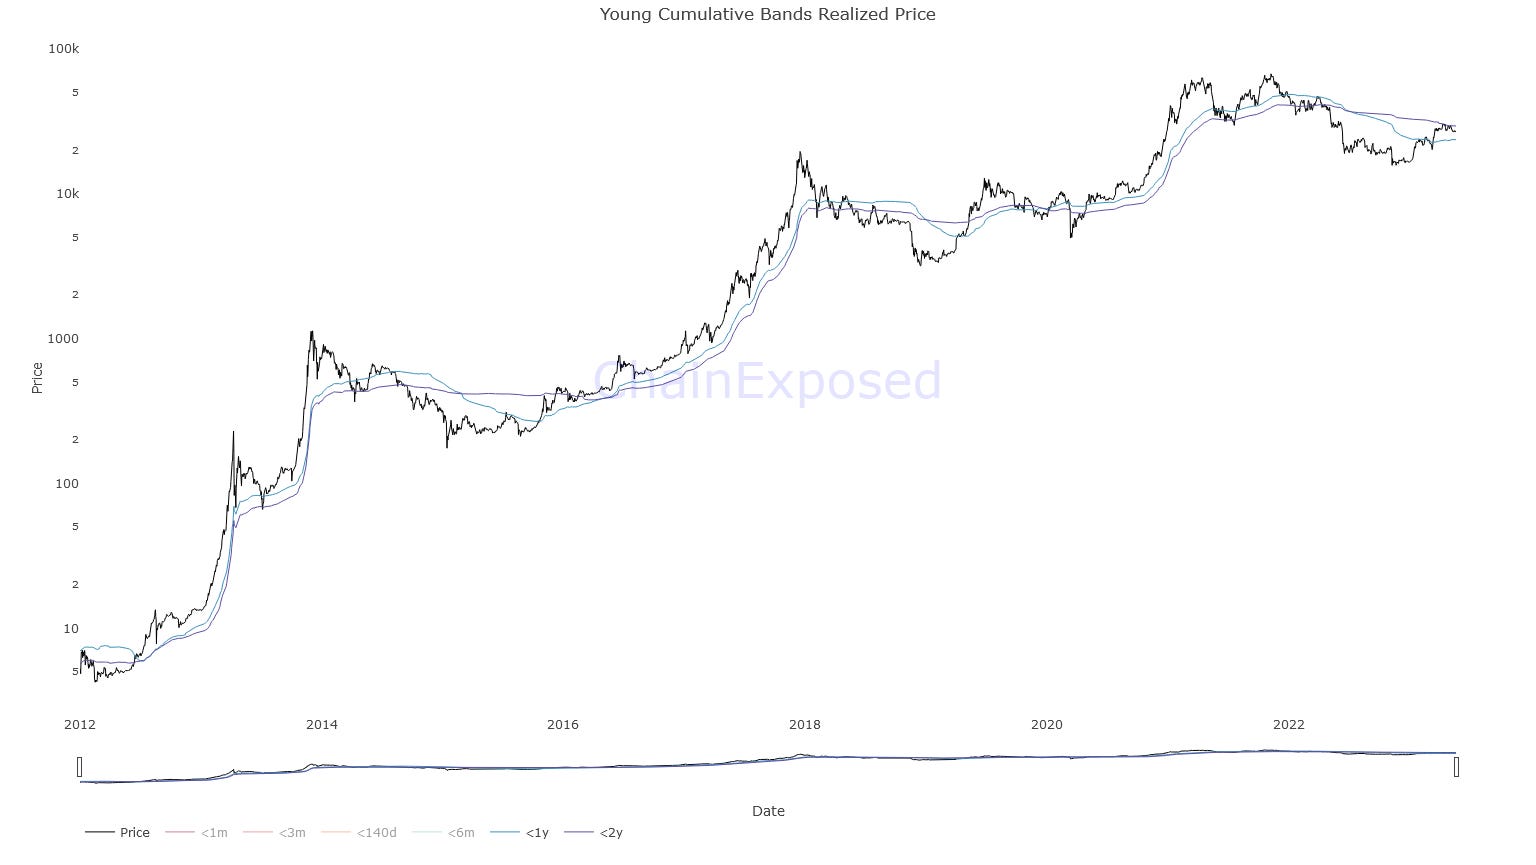
Here instead we have the realized price of the same categories of hodlers and as we will soon see, here things change a lot, because if with the SOPR what interests us most is the aggregate data coming from the long-term holders, here instead what impacts more the price is a mix between the two, and more for that concerning the short term holders.
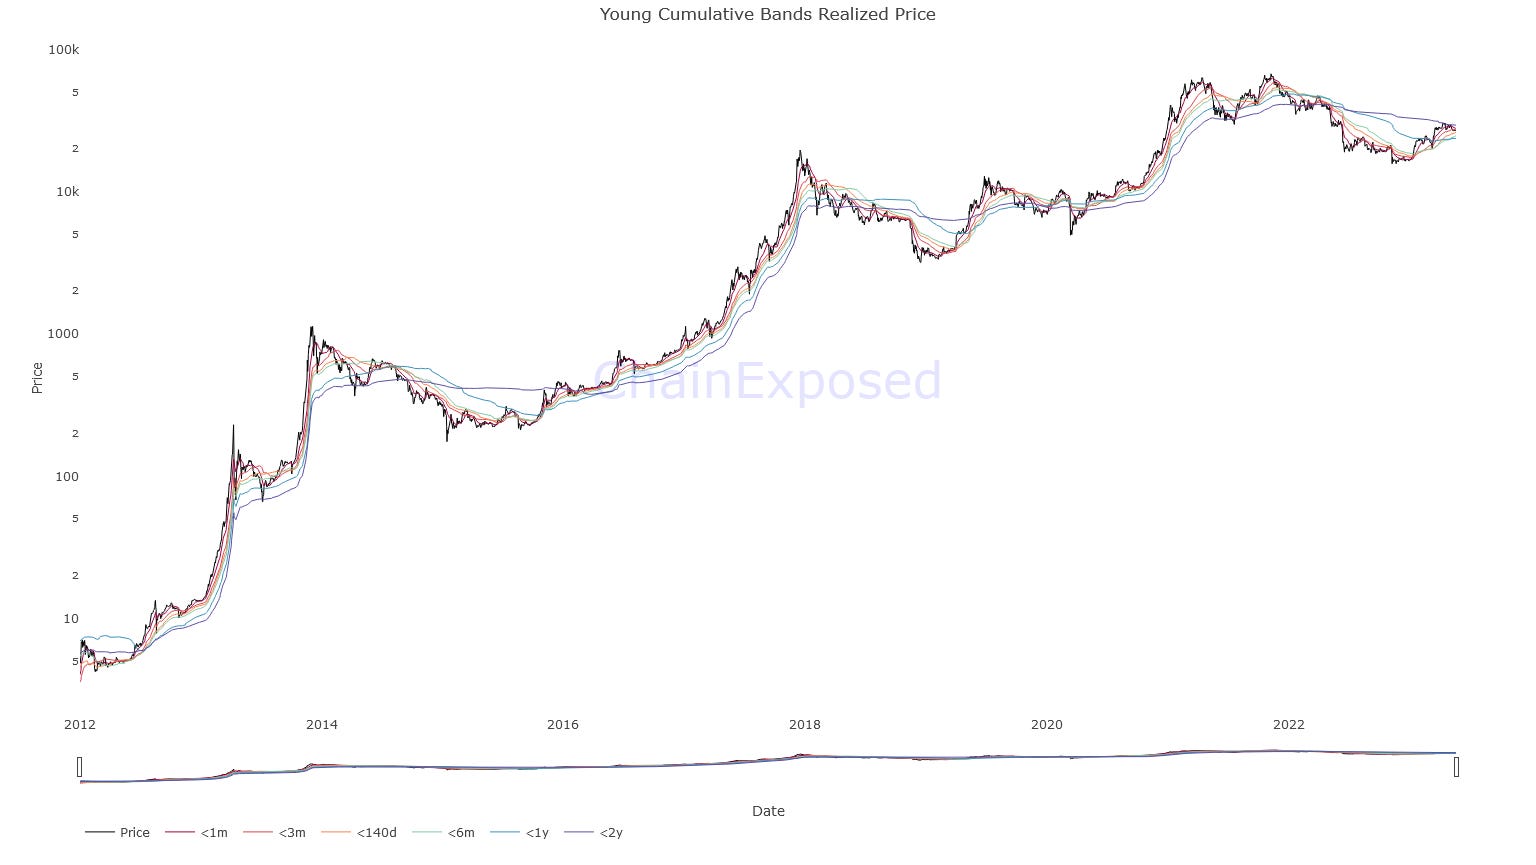
Here we have the realized value of holders who have held BTC for 6 months or less and as you can see their realized price is very important to the BTC price action.
These are the so-called Short term holders, the speculators more or less, who, as can be seen, move the price depending on whether they are above or below their realized price and above all when they return to their base cost at 24.8k
However, other realized prices are important for the current price action, but not equally important for price action in general, even if it can be safely said that these realized prices mark the point that differentiates a bear market from a bull market.
Currently $29,440 is our onchain resistance, the realized price of holders from two years onwards, a value that we must overcome in order to obtain greater confluence regarding our return to bull market thesis in the coming months
That of holders for less than a year is 23.7k
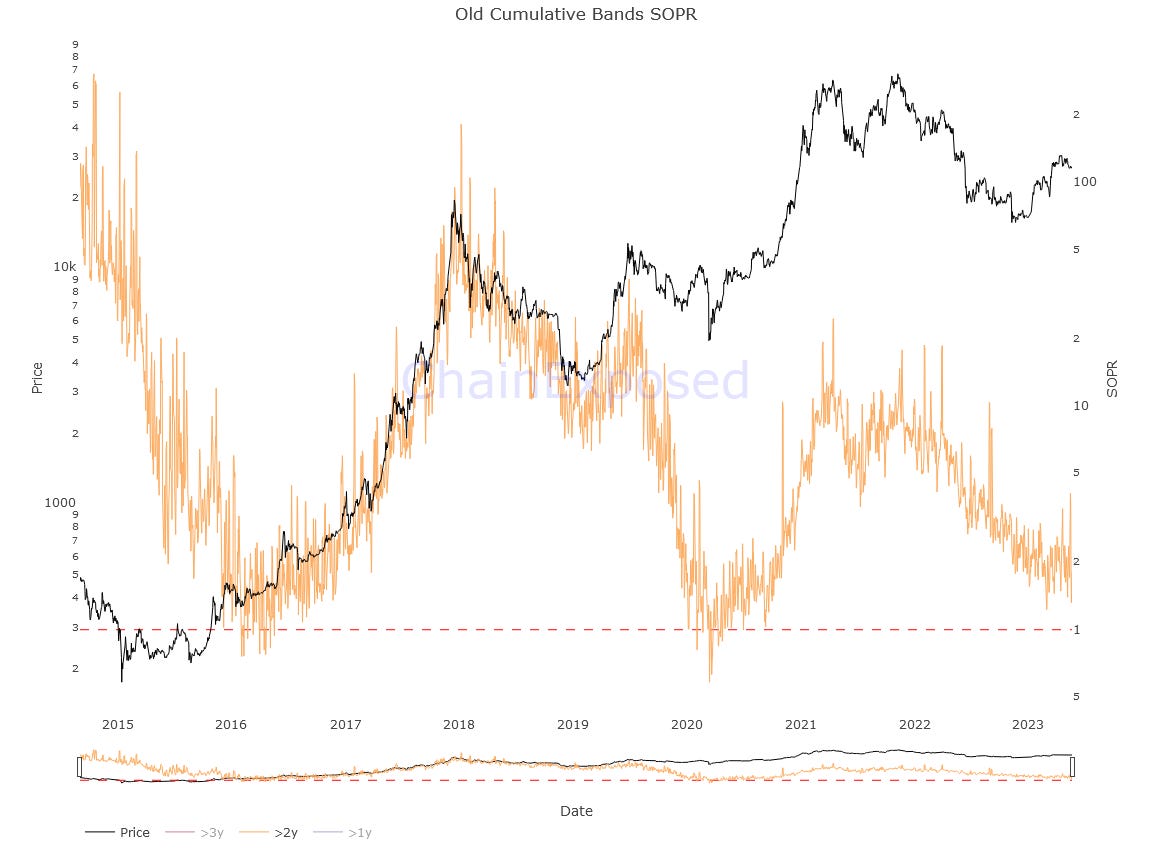
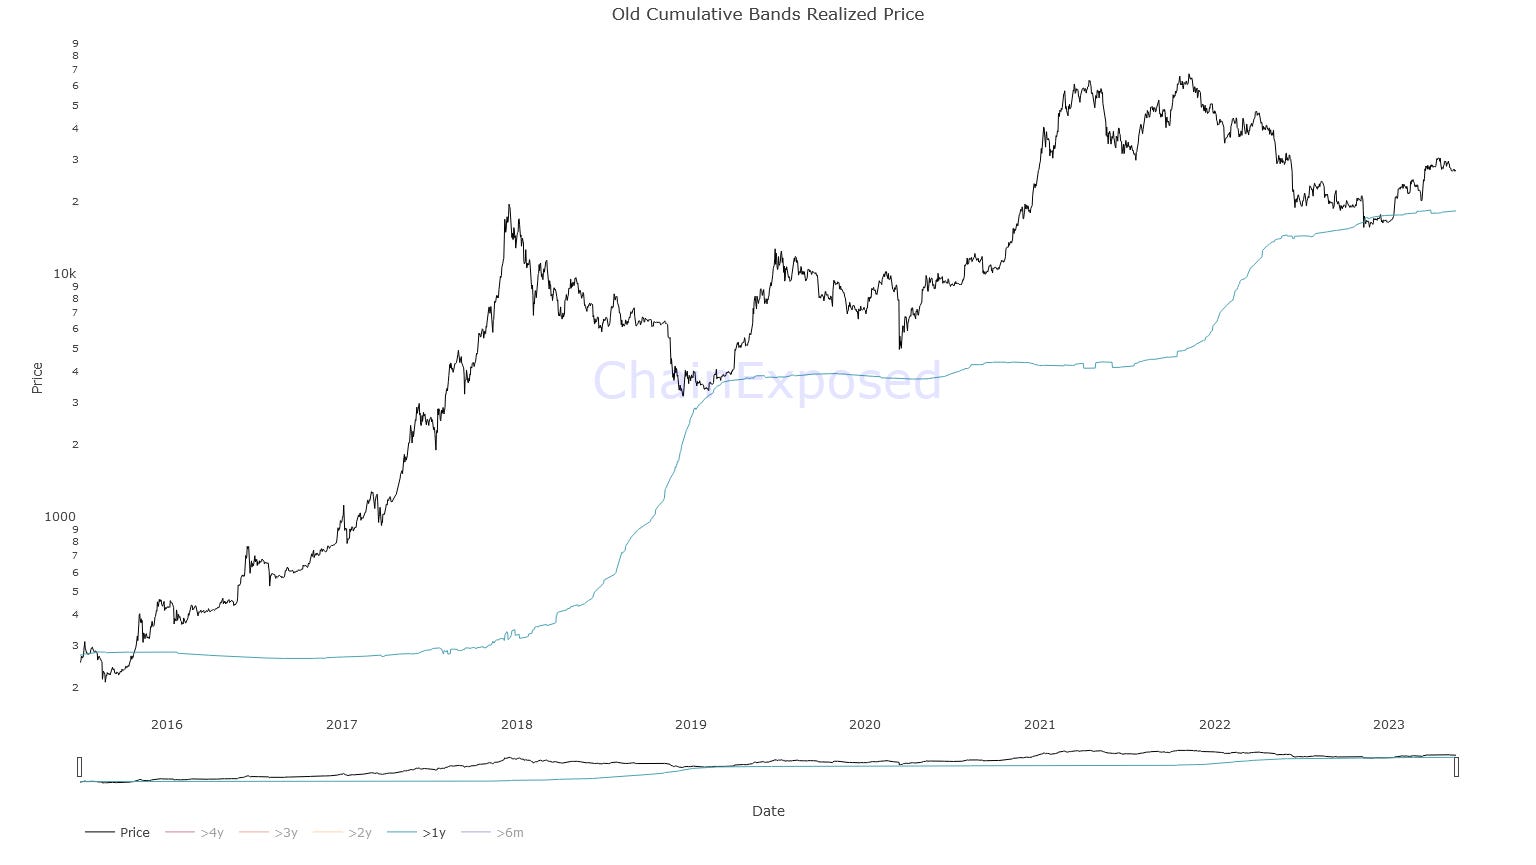
Old Cumulative Bands SOPR and Realized Price
Old Cumulative Bands is an onchain metric that looks at hodlers in three categories: year-olds, 2-years-old, and 3-years-old.
Let's take them one at a time, starting with the SOPR
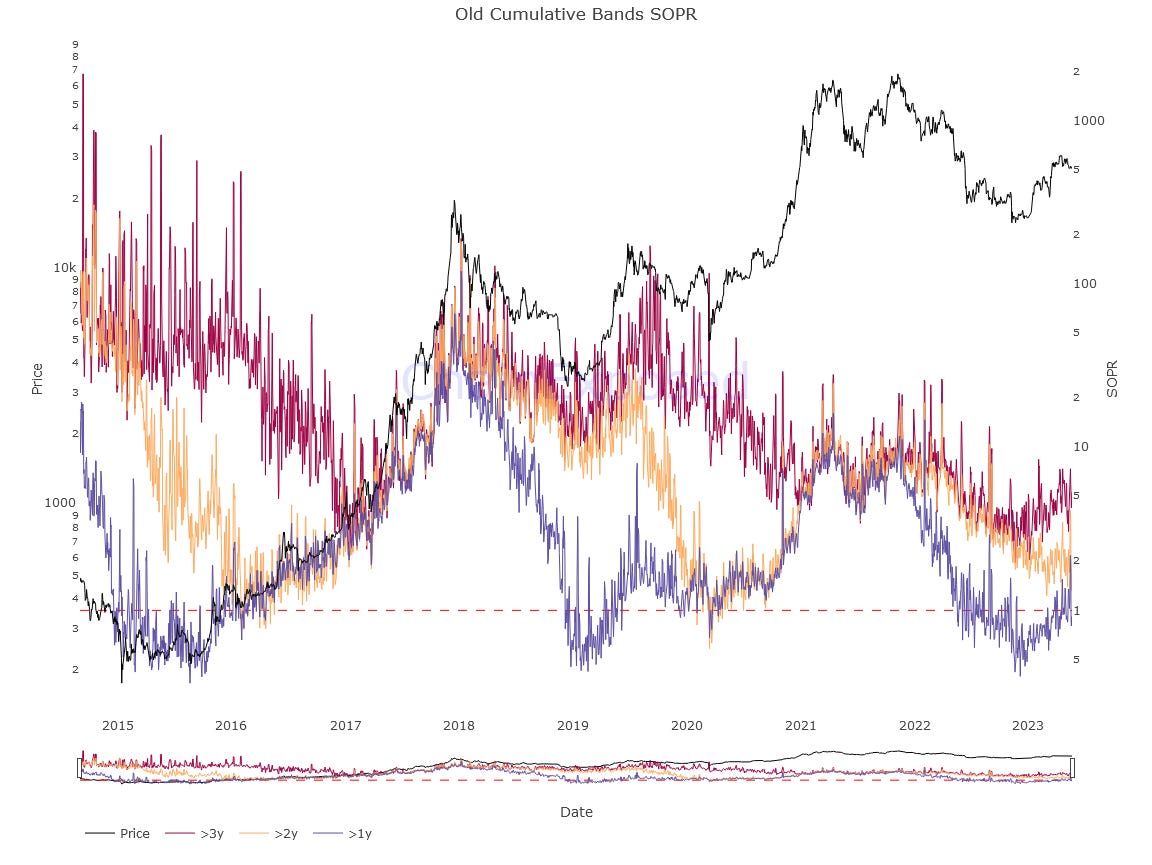
Holders for more than a year seem to have a tendency to fall to negative profitability levels only in the deepest bear markets, remaining profitable even in turbulent times like the COVID crash.
the fact that we recently got out of the area below 1 indicates some change in the market, and if we manage to stay above 1 for much longer this would signal a total trend reversal, probably final and final of this last bear cycle
As for the more than 2-year holders, they only touched parity levels in the phases just before a new sustained price hike, as this is probably also helped by their accumulation at the parity level.
We haven't hit those levels yet, but by the time we do we'd be pretty sure the bull market is coming if supported by other metrics we've already covered in abundance over the past few weeks, so stay tuned for more.
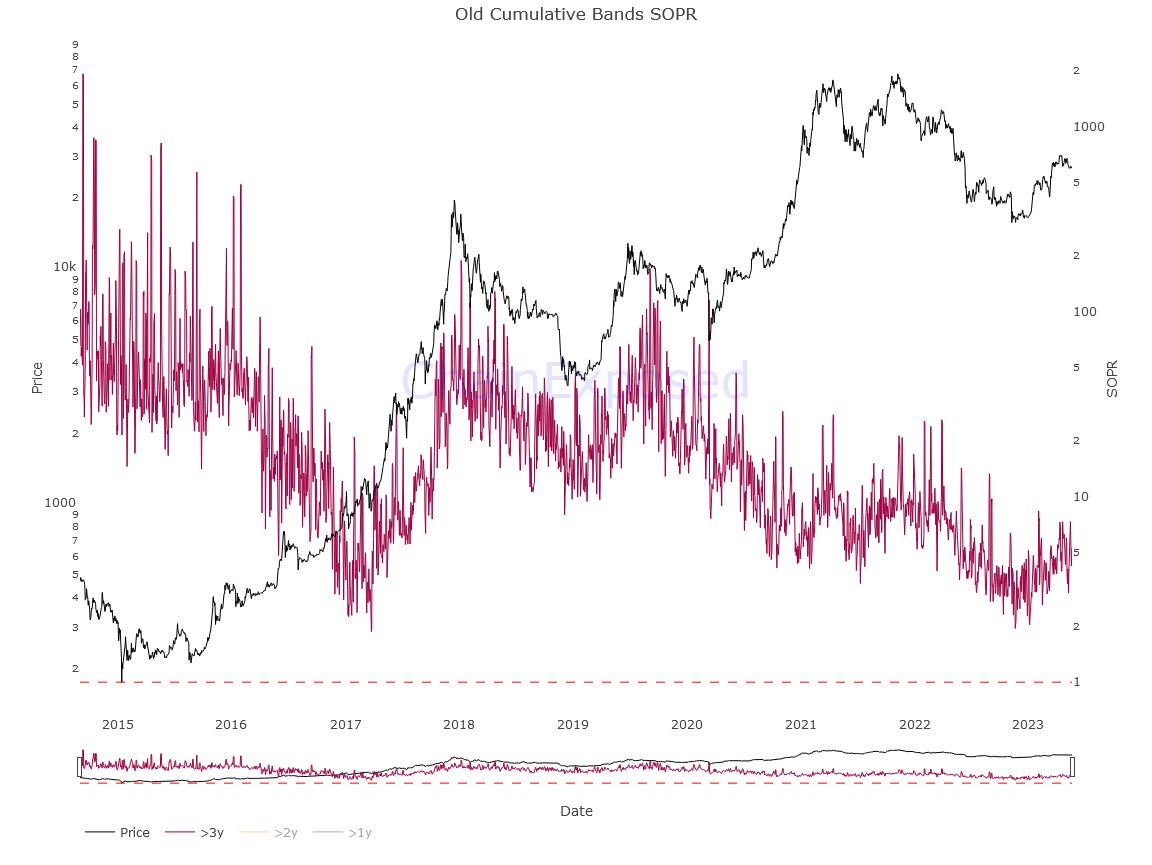
From holders of more than 3 years we do not even expect a return to parity, but simply an increase in their levels in general in the coming months, having already reached levels similar to those reached just before the start of the 2017 bull market in recent weeks , which is equally bullish in my opinion.
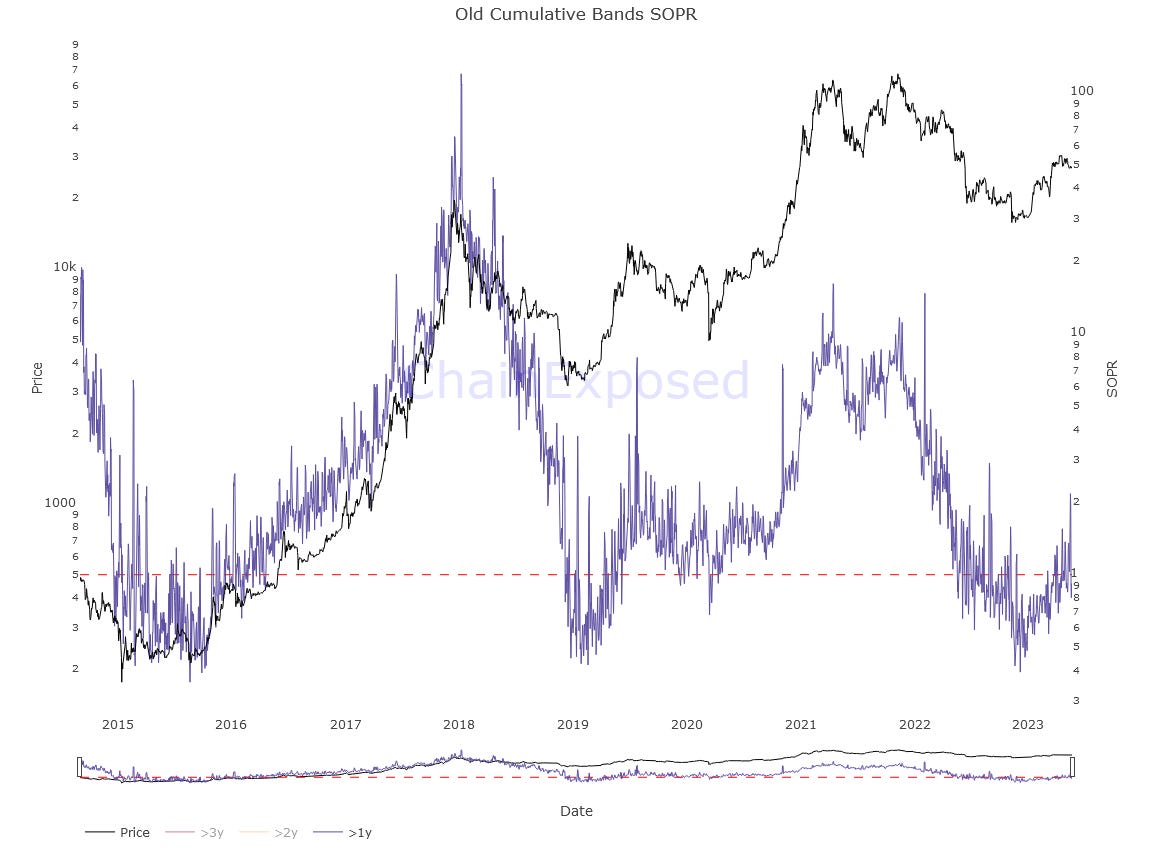
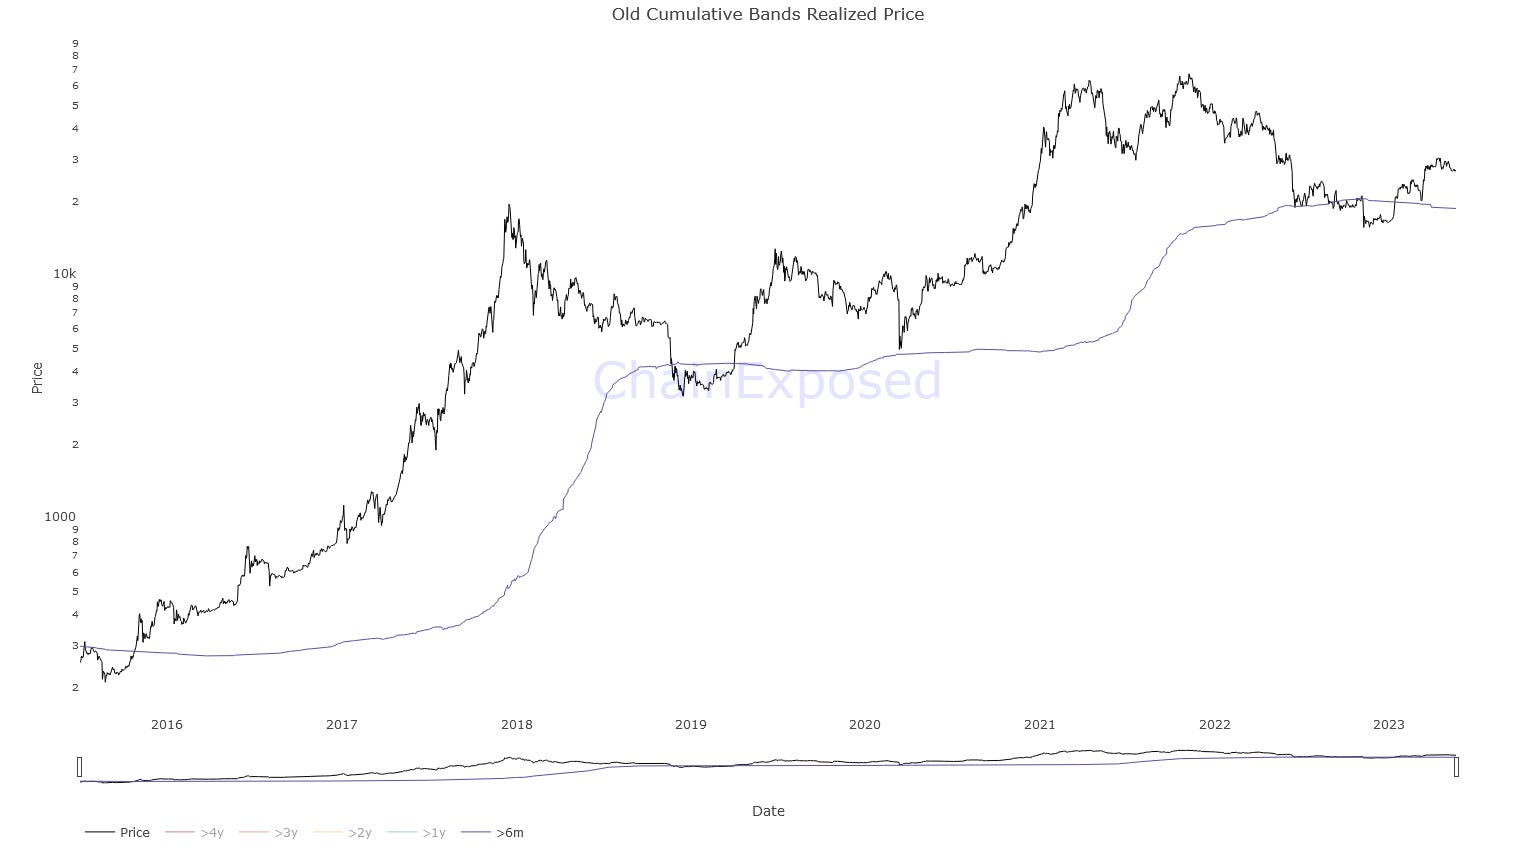
Speaking of realized prices instead for the same categories of hodlers, we can see that only a couple are actually useful for our comparative analysis. those of 6 months and more and that from one year upwards.
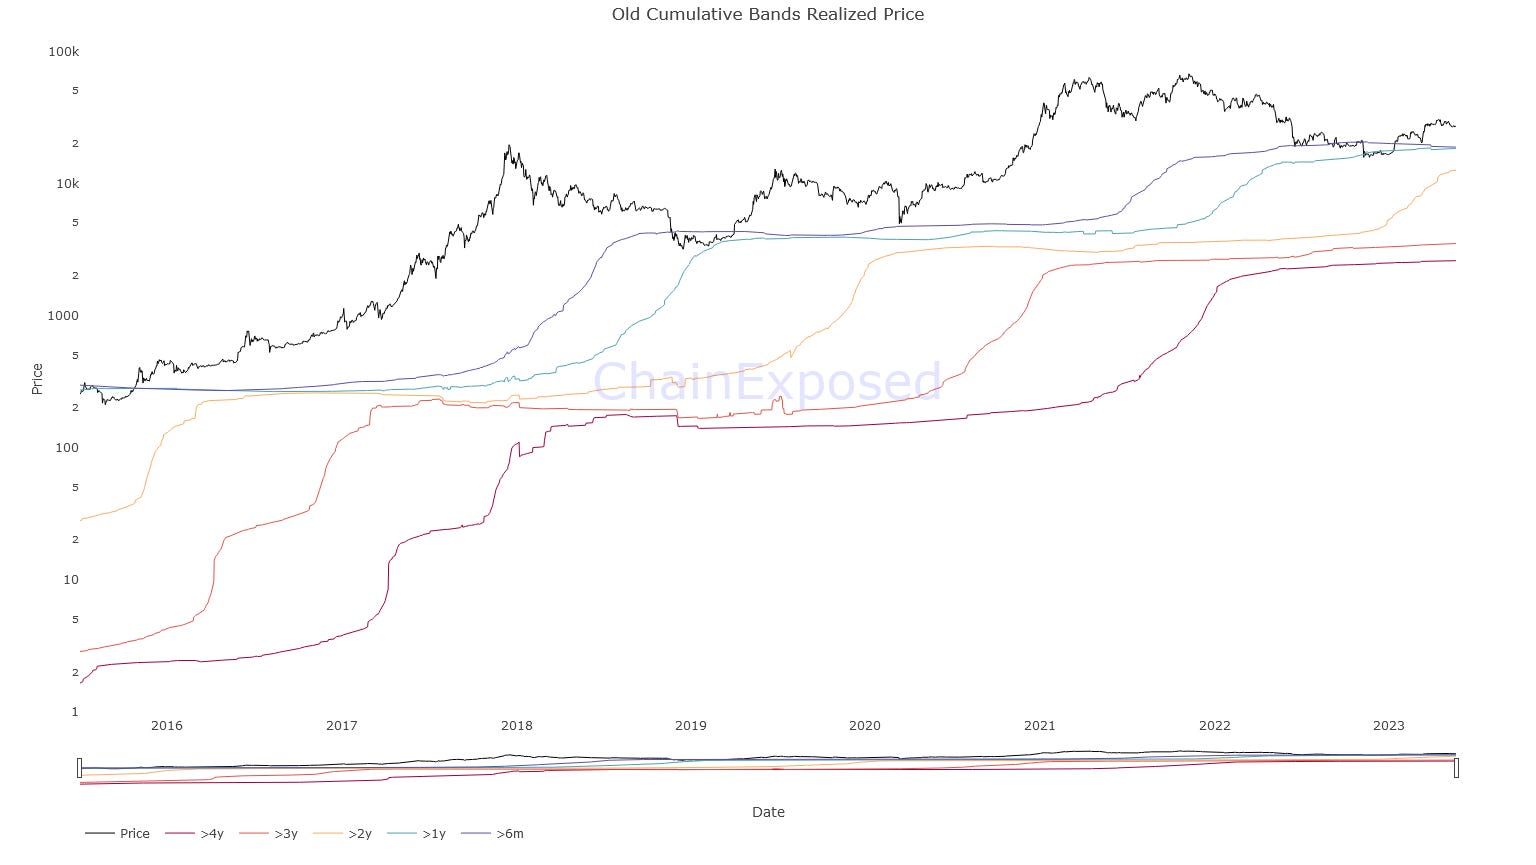
Hodlers for more than 6 months have a basic cost that is very close to that of the deepest bear market and could be a very good starting point for long-term accumulation or in any case for aggressive reinvestment in bearish market phases.
Having recently broken through it and used it as support, we are now off the bottom of the market which is another bullish sign.
Instead, hodlers for more than a year have a realized price that has always coincided with the actual bottom in the last two cycles. In this case we could use it in the same way and to replenish our stock even more until the investment funds placed in reserve are exhausted.
To be observed also for the next bear markets
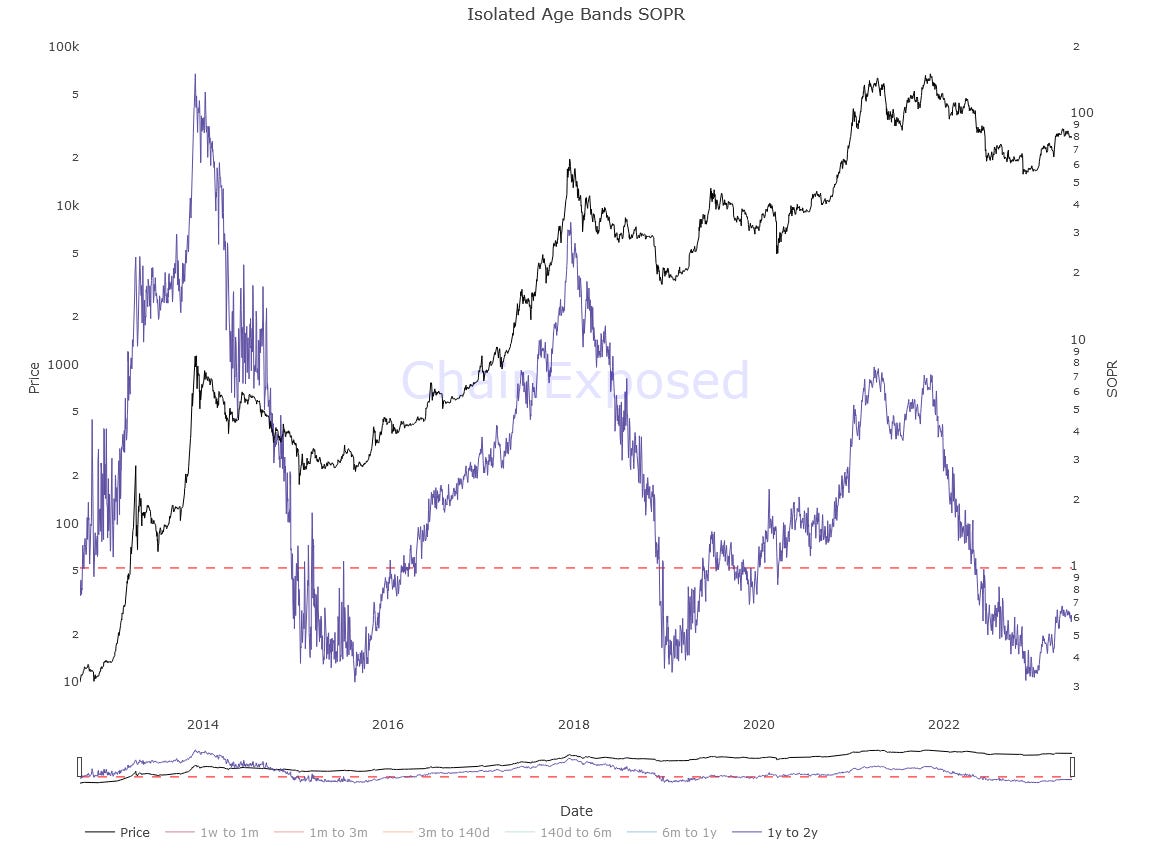
Isolated Age Bands SOPR and Realized Price
Isolated Age Bands, on the other hand, takes into consideration hodlers divided into isolated time bands, i.e. from one specific amount of time to another.
As always, let's examine them step by step, starting from the SOPR
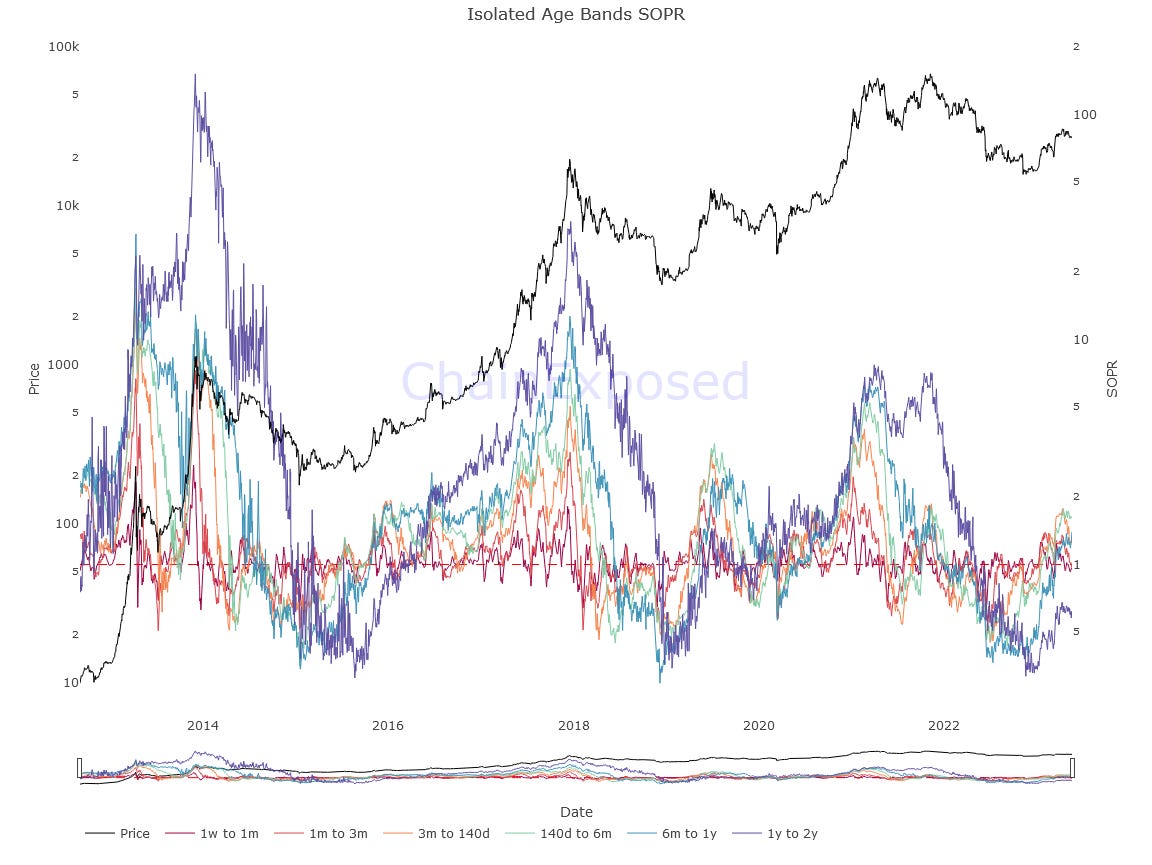
The SOPR of the Short term holders ranges, i.e. holders for less than 3 months, can certainly be used to help find local tops or bottoms and therefore to trade (find an example in the dedicated Youtube Video below), but to get an idea of where we find ourselves it doesn't help much, so let's continue with the others.
The months to year categories seem to have behaviors that lead to similar levels of profitability, even if clearly more accentuated when it comes to holders from 6 months to the year, the blue ones
Here it is difficult to go below profitability levels below 1 again if you have exited the bear market. It will therefore be necessary to keep track of their SOPR in the coming months, to avoid going unprepared for another drop in prices, not presumed for now
The SOPR that strikes us the most, however, is that of holders from one to two years, which clearly tells us that for this category of hodlers the bear market is still in its most acute phase, despite the slight increase in profitability.
In fact, these categories of hodlers bought close to the top of the bull market and are the category that is suffering the most from the profitability side.
As soon as these too have recovered their 1 line, using it as support, we have the final proof of an upward bull market.
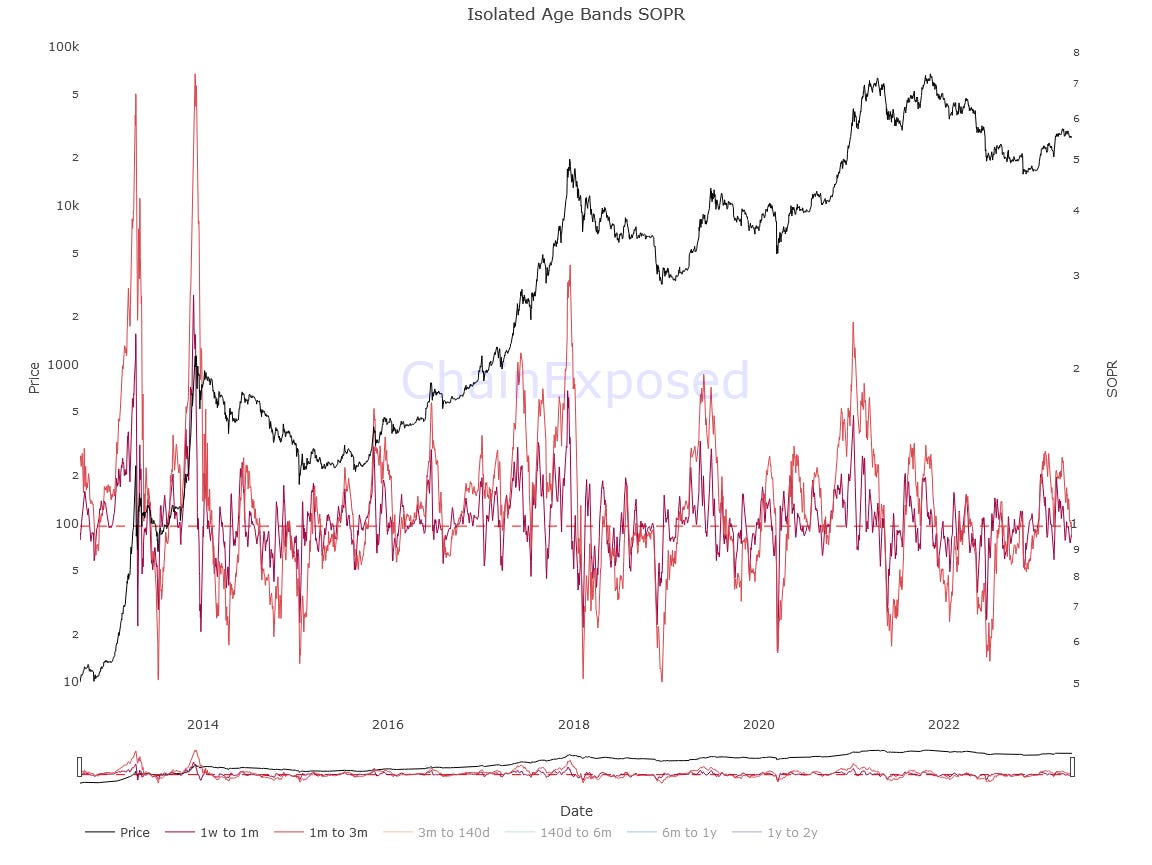
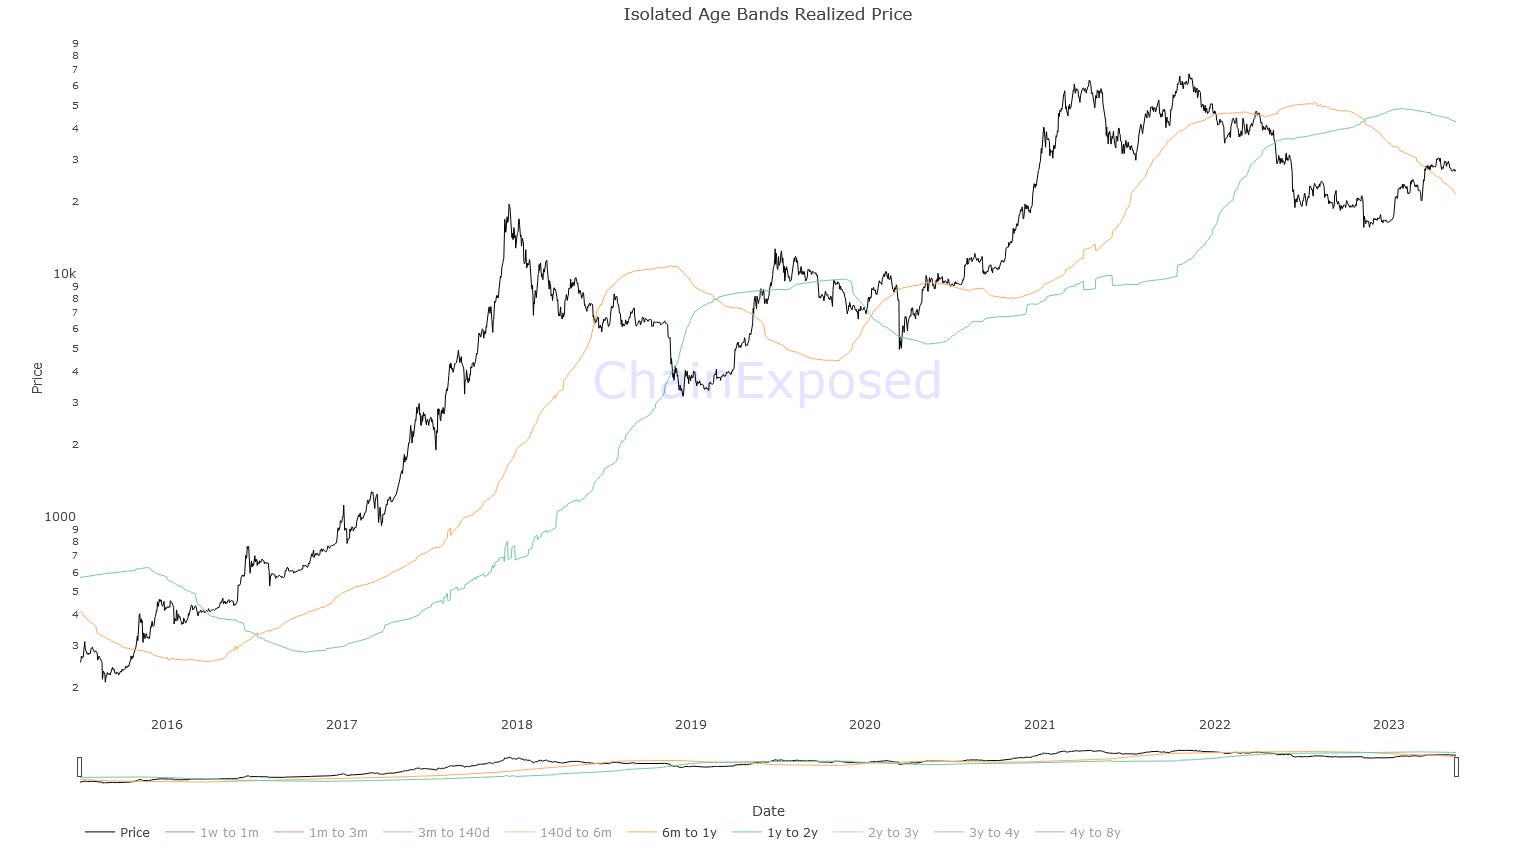
But let's go to the realized price.
Here we notice how many categories, as in the previous graphs, are not even to be taken into consideration due to the very low value of their basic cost, such as the one that goes from 4 to 8 years, the purple one, so let's go and see which ones may interest us the most
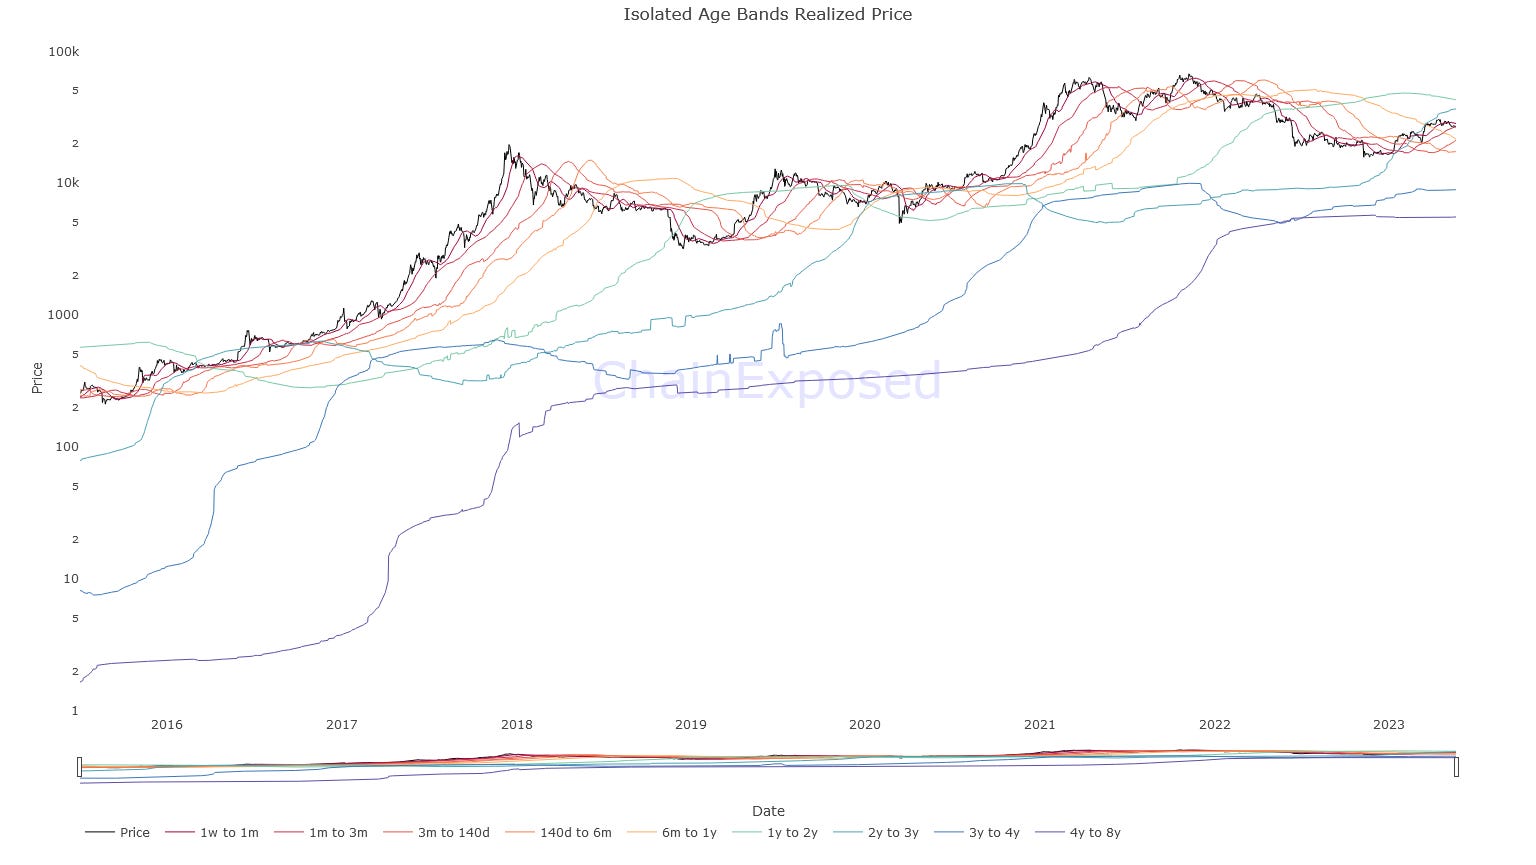
First of all, we must and can state with absolute statistical certainty and with data in hand that most of the price movement occurs for and because of traders or short-term holders.
As you can see the various realized values move like waves around the price. This is because the aforementioned holders take advantage of every opportunity to enter and exit the market on the occasions they deem most profitable, using trading logics and consequently moving the price also depending on their investment in derivatives and DeFi protocols.
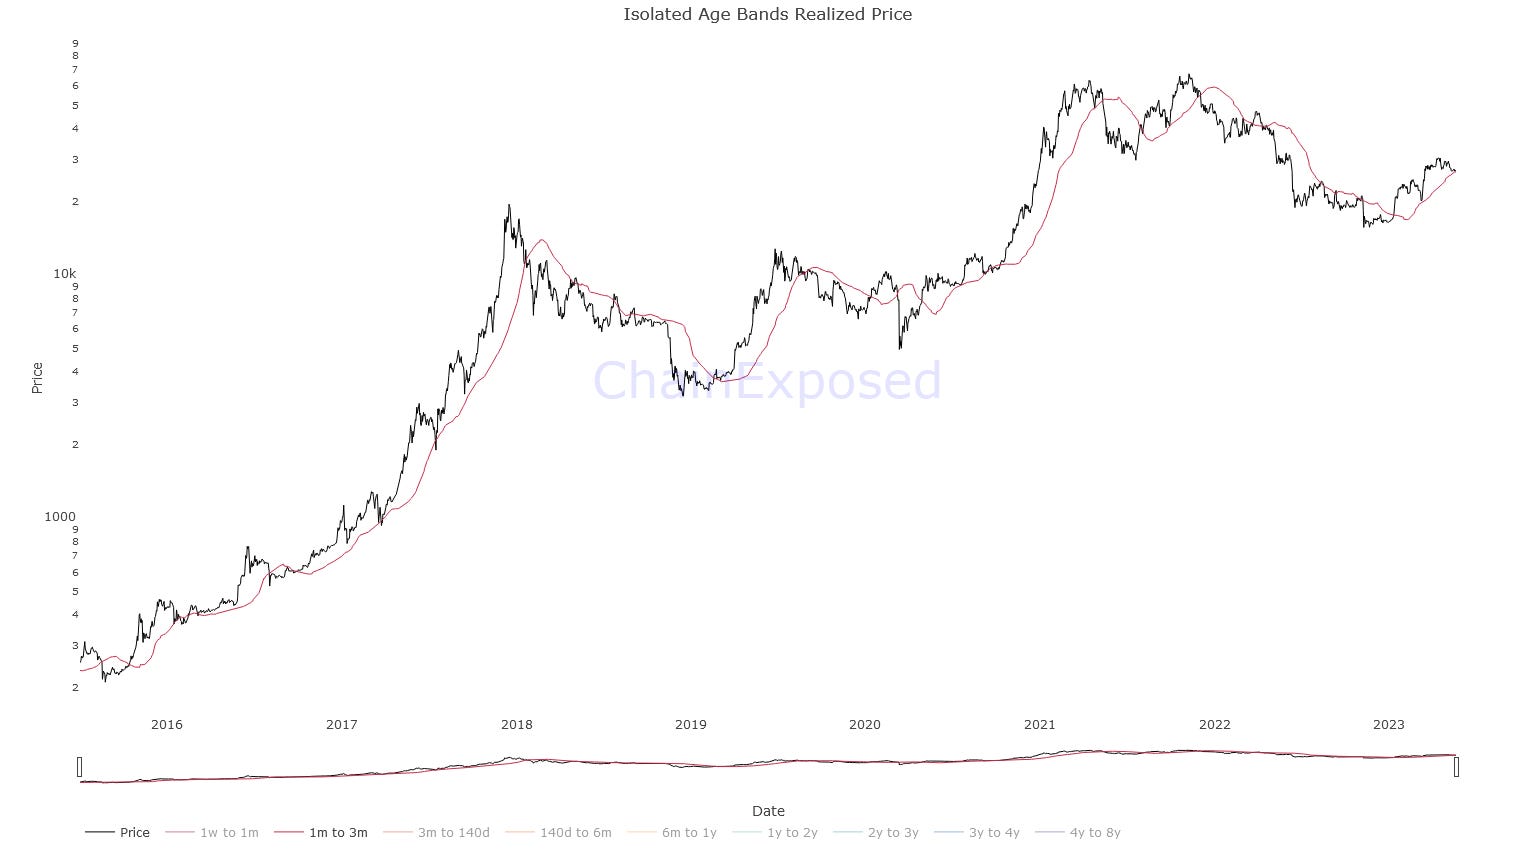
The category of short term holders that interests us the most is the one that goes from one month to 3 months of holding.
In fact, we can see how their realized price, currently at $26,680, is taken as a basis for support for declines in bull markets and as resistance in bear markets.
In this category we can assume that most of the short term holders reside, as their realized price closely resembles that of the short term holders in aggregate
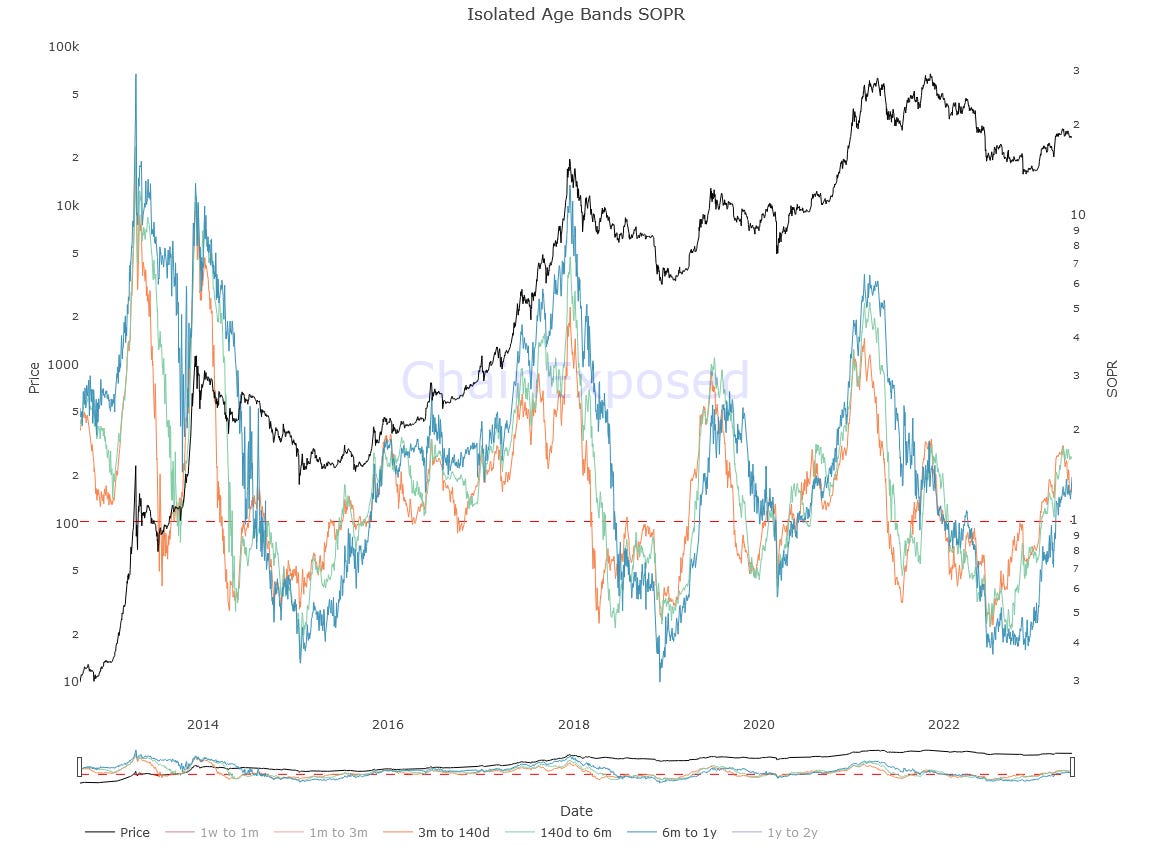
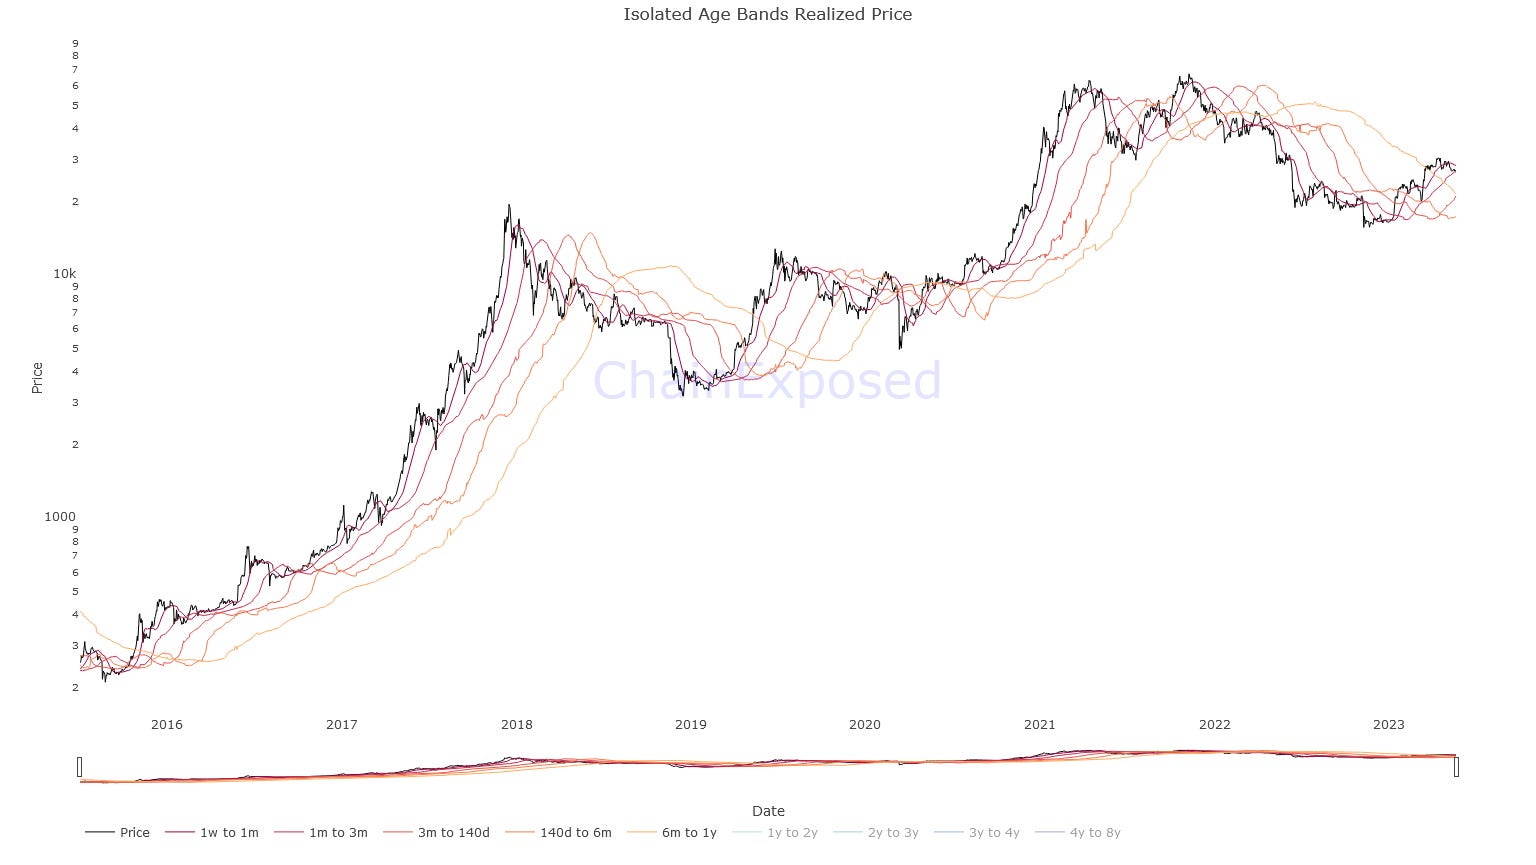
On the other hand, the realized prices of the Long-term holders which are more useful for a comparative analysis are in this case those of the holders from 6 months to the year, currently $21,560 and at the time of the local top in March at 27.9k , and from one year to two years, to date 42.9k.
In fact, these two seem more in line with who are the tops and bottoms in the different phases of the market.
In fact, as we can see, from 6 months to one year it is first used as a support base before the last bull market and then as resistance in the first bear market rally and finally in this last rise.
From 1 year to 2 years, on the other hand, the situation is similar but as regards the post bear market 2018/2019 price increases, up to supporting the price during the Covid Crash, and then subsequently accelerating the price descent after its downward break in the last bear cycle and now finding itself in a price area where it is resisting alongside the base cost of a humpback at 47.5k as we saw during the last analysis.
So we see that it doesn't matter which way you look at it, but SOPR values of Long-term holders above 1 inevitably lead to the bull market, while their realized values are very important for aggressive accumulations with long-term targets and for identifying important resistances ( to be taken into consideration through the technical analysis), while the SOPR of the short term holders is to be taken into consideration in confluence with their realized profit for short-term and trading operations, but also to know the points of maximum importance for the price, top and bottom, with medium-term operations.
Author
Joele Novelli
Socials:
Twitter - Telegram - Youtube - LinkedIn - Instagram - Newsletter - TikTok
(All opinions expressed above are the author's personal opinions and should not form a basis for making any investment decisions, nor should they be construed as a recommendation or advice for engaging in any investment transaction.)